With a monthly salary of 3,000, an annual income of 36,000, a lifetime total income is expected to reach 1.44 million yuan;
With a monthly salary of 4,000, an annual income of 48,000, a lifetime of wealth accumulation is expected to reach 1.92 million yuan;
With a monthly salary of 5,000, an annual income of 60,000, a lifetime total income is expected to be 2.4 million yuan;
With a monthly salary of 6,000, an annual income of 72,000, the accumulated wealth in a lifetime will likely reach 2.88 million yuan;
With a monthly salary of 7,000, an annual income of 84,000, a lifetime income is expected to be 3.36 million yuan;
With a monthly salary of 8,000, an annual income of 96,000, a lifetime total income is estimated to reach 3.84 million yuan;
With a monthly salary of 9,000, an annual income of 108,000, a lifetime of wealth accumulation is expected to exceed 4.32 million yuan;
With a monthly salary of 10,000, an annual income of 120,000, a lifetime total income is expected to be 4.8 million yuan;
With a monthly salary of 20,000, an annual income of 240,000, a lifetime of wealth accumulation could be as high as 9.6 million yuan;
With a monthly salary of 30,000, an annual income of 360,000, a lifetime total income is estimated to be 14.4 million yuan;
With a monthly salary of 40,000, an annual income of 480,000, a lifetime of wealth accumulation is expected to reach 19.2 million yuan;
With a monthly salary of 50,000, an annual income of 600,000, a lifetime total income is expected to reach 24 million yuan.
However, there are very few people with monthly salaries over 10,000, and even fewer with monthly salaries over 20,000. Most people's monthly salaries still hover below 10,000, and it seems that the income of ordinary people in a lifetime is barely enough to buy a house.
So, how much do you want to earn before you stop in the crypto world?
If you are over half a hundred years old, then my suggestion is to hold 10 bitcoins, after all, the value of Bitcoin is likely to skyrocket to a million level in the future. Conservatively estimated, one Bitcoin is worth a million, and 10 is ten million. Holding 10 bitcoins is equivalent to owning the income of an ordinary working elite for a lifetime!
If you are in your forties, then 5 bitcoins is enough;
If you are in your thirties, 2 bitcoins is enough;
If you are in your youth, 0.5 bitcoins is enough;
If you are still a child, then 0.36 bitcoins is enough.
If you are in the 30-40 age group and currently hold 20 bitcoins, then you have the key to a free life; if you hold 100 bitcoins, then the whole world will be yours to roam. Come on, friends in the crypto circle!
Although there are many ways to make money, the lessons learned from them are often very similar.
Core principles - Don't trade crypto in three cases:
Avoid buying when prices rise: Prices are often overvalued when market sentiment is high. Conversely, buy during market corrections or declines, taking advantage of market fear to acquire low-priced assets.
Diversify risk: Don't bet all your funds on one coin. Diversifying your investment can spread the risk, even if a certain coin performs poorly, it will not fatally damage the overall investment.
Control the position size: operating with a full position will limit your flexibility. Retain a certain amount of cash reserves so that you can quickly adjust your strategy when the market trend does not meet expectations.
Six commandments for short-term crypto trading:
New highs often follow high-level consolidation, and new lows often follow low-level consolidation: high-level consolidation usually indicates a new round of increase, while low-level consolidation may usher in further decline. Wait for the trend to be clear before taking action.
Do not trade during sideways movement: When the market lacks a clear direction, the best course of action is to wait and see until the trend becomes clear.
Buy when the price falls, sell when the price rises: A contrarian strategy, buy when the market is generally bearish, sell when the market is generally optimistic, reducing the risk of chasing ups and killing downs.
Judge the rebound strength according to the speed of the fall: A rapid fall is often accompanied by a rapid rebound, while a slow fall may lead to a more moderate rebound.
Pyramid-style position building: gradually increase the position size, especially increase the purchase when the price falls, reduce costs, and lay the foundation for future returns.
Sideways movement is inevitable after continuous rise and fall: long-term price movements will experience a consolidation period, with small price fluctuations. It is not advisable to rush in and out at this time, wait for the next trend signal.
Six fatal mistakes to be wary of in trading
One, heavy position must die, two, no stop loss must die, three, insatiable desire + must die, four, blind entry + must die, five, frequent operation must die, six, left-side operation must die. These experiences can only be understood after many painful lessons.
Unfortunately, retail investors don't have a long memory, and they lose a lot of money every time because of these things. Are you also paying for the same mistakes? Every loss is a profound lesson, but why do most traders still find it difficult to avoid repeating the same mistakes.
First, heavy position must die, the cost of greed. Heavy position trading is one of the easiest mistakes for traders to make. When you invest a lot of money in a trade, you are actually replacing rational decision-making with a gambler's mentality. The volatility of the market determines that any transaction has risks, and heavy positions will only amplify this risk, making you unable to withstand potential losses. Heavy position trading often leads to broken capital chains, or even complete elimination. The unpredictability of the market means that you can never guarantee that every heavy position will be profitable. It is recommended to diversify investments, strictly control the risk exposure of each transaction, and control the risk of each transaction between 1% and 2% to ensure that even if losses occur, they will not cause devastating damage to the overall funds.
Second, no stop loss is a must-die, the graveyard of wishful thinking. No stop-loss trading is the second major death hole for traders. Without a stop-loss plan, you cannot effectively control risk, and in the end, you can only be passively beaten in market fluctuations. No stop-loss trading will prevent you from exiting in time when you lose money, resulting in continuous expansion of losses, and even loss of money. It is recommended to clearly set a stop-loss point before each transaction and strictly implement it. Stop loss is not admitting defeat, but a basic respect for market risk,
Third, insatiable desire must die, the trap of desire. Insatiable desire is one of the weaknesses of human nature. Traders often try to earn unrealistic profits, but ignore the potential risks of the market. Overly pursuing profits will make you hesitate when you are profitable, eventually missing the best time to leave the market, and even leading to profit retracement. It is recommended to set reasonable profit targets and leave the market in time when the targets are reached. Remember, trading is not charity, your goal is to make steady profits, not to get rich overnight.
Fourth, blind entry must die, the adventure of the ignorant. Blind entry is a manifestation of a lack of trading plan. Having no clear entry logic is just gambling, not trading. Blind entry will make you lose your way in the market and eventually fall into the abyss of losses. It is recommended to formulate a detailed trading plan before entering the market, including entry point, stop loss point, take profit point, and risk-reward ratio. Only when the plan is clear can you enter the market with confidence.
Fifth, frequent operation must die, the lack of patience. Frequent operation is a manifestation of traders' eagerness for quick success. Over-trading not only increases trading costs, but also increases the probability of making mistakes. Frequent operation will make you exhausted in the market, and eventually make mistakes due to fatigue and emotional fluctuations
Sixth, left-side operation must die, the wrong timing. Left-side operation refers to forcibly entering the market when the market trend is unclear. This behavior often leads you into a quagmire of losses. Left-side operation will cause you to bear huge risks in market fluctuations, and eventually lose money due to misjudgment. It is recommended to wait for the market trend to be clear before entering the market. Right-side operation may miss some profits, but it can effectively reduce risks
In the trading market, many people are superstitious about "frequent trading" and "daily compound interest", believing that this is a shortcut for small funds to grow rapidly. However, the truth is: frequent trading will not only not make you rich, but will also plunge you into the abyss. Today, we will reveal the fatal trap of frequent trading from multiple perspectives such as mathematical probability, cognitive dimension, and market structure, and tell you the true core of small funds to grow bigger - pattern and cognition.
1. Watch sideways, move when the market changes
When the price fluctuates in the 3% range for more than 72 hours, try with a 30% position. Add positions after breaking through key resistance levels (such as the 20-day moving average) to avoid blindly bottoming out and top-picking.
2. Don't linger on hot spots, and rotate positions
Use the "Hot Spot Thermometer" indicator to monitor: When the single-day increase of a certain coin exceeds 50% and the mention volume on social media surges, clear the position in the morning session of the next day. Historical data shows that the probability of callback for this type of coin within 72 hours is 83%.
3. Hold firmly when the price jumps high, don't let go
When an "Island Reversal" pattern appears (the price opens higher and the trading volume increases by more than 3 times), firmly hold it until the RSI indicator is overbought (>80) and then take profits in batches. During the Ethereum Shanghai upgrade in 2024, this strategy helped me win 127% profit.
4. Huge volume of Yang line, leave the market at the end of the day
Regardless of high or low positions, when the single-day trading volume breaks twice the 60-day average volume, clear the position before 14:50. After the Dogecoin Musk event in 2023, this strategy allowed me to avoid a 38% retracement.
5. Buy when the price is above the line and falls, sell when the price is below the line and rises
Use the 55-day moving average as the lifeline: buy when the price is above the line and falls (down <2%), sell when the price is below the line and rises (up >3%). Combining with the MACD golden cross signal can increase the win rate to 68%.
6. Don't sell when the price surges, don't buy when the price plummets.
Set dynamic take profit: When the price falls below the lowest price of the recent 3 K-lines, immediately close the position. During the BNB ecosystem outbreak in 2024, this method earned 42% more profit.
7. Prepare before buying, and enter with small positions first
Adopting the "Pyramid Position Building Method": the first position should not exceed 20%, add 10% for every 5% drop, and reduce the position by 3% rebound. This strategy can reduce the average cost by 15-20%.
The Mathematical Trap of Frequent Trading: Why Are You Destined to Lose Money?
1. The "invisible killer" of transaction costs
Assuming the transaction cost is 0.5% per transaction (including commission and slippage), if you trade 5 times a day, the annual transaction cost will be as high as 625%! This means that even if your win rate is high, frequent trading will allow your funds to be swallowed up by costs.
2. The Cruel Truth of Winning Percentage
Even if you have a 60% win rate, what is the expected return of 100 trades? The calculation is as follows:
(60 profit times x1%-40 loss times x1%)-100 transaction times x0.5%=-0.3% That is to say, the final result of frequent trading is likely to be a loss.
3. The warning of the Kelly formula
The Kelly formula tells us that when the trading frequency exceeds the optimal betting frequency, the fund curve will show an exponential decline. Frequent trading is like walking on a tightrope on a cliff, and if you are not careful, you will fall into the abyss.
II. Cognitive degradation: Frequent trading makes you a "market leek"
1. The trap of the time frame
Research shows that the noise in 5-minute K-line charts accounts for as high as 92%, while the noise in daily charts is only 37%. Frequent traders are often misled by short-term fluctuations and ignore the real trend.
The collapse of decision-making quality "Miller's Law" in psychology points out that the upper limit of effective decisions for the human brain in a single day is 7+2 times. Frequent transactions lead to a cliff-like drop in decision-making quality, eventually turning into emotional operations.
3. The huge waste of opportunity cost
Frequent traders spend 90% of their time capturing 10% of low-quality fluctuations, but miss the real big trends. This "picking sesame seeds and losing watermelons" behavior is destined not to achieve qualitative changes in funds.
The truth about market structure: why are you always a loser?
1. The cruel reality of liquidity layering!
Top institutions can obtain T+0 arbitrage opportunities, while retail investors can only trade secondary liquidity. Frequent traders are destined to be at a disadvantage in this unequal game.
2. The secret of volatility
Taking the S&P 500+ as an example, data from the past ten years show that annualized gains of over 70% are often concentrated in 7-10 trading days. Frequent traders are likely to miss these key opportunities.
3. The dilemma of negative-sum games
High-frequency trading is essentially a negative-sum game. The more participants, the closer the expected return is to zero. Frequent traders are like gamblers constantly betting in a casino, and will eventually lose all their chips.
IV. The winning way of top traders: pattern and cognition
1. Opportunity filter+: Only catch first-class opportunities
Top traders will establish a three-dimensional evaluation system (trend strength, volatility quality, risk premium) and only choose the best opportunities to write articles
2. Focus on exerting force at key points
Regard funds as a probability wave, and only release them intensively at the potential energy critical point. This "crocodile" waiting philosophy can make the fund curve show exponential growth.
3. Cognitive arbitrage: using the market's collective misjudgment
True excess returns come from cognitive differences. For example, the negative price event of crude oil futures in April 2020 is a typical example of collective market misjudgment. Top traders are good at capturing this macro mismatch opportunity.
V. The path of advancement from small funds to large funds
1. From "operation addiction" to "strategic patience"
The essence of trading is the realization of cognition, not the accumulation of operations. When you learn to wait patiently and only seize key opportunities, the growth of funds will come naturally.
Build a "Major Event Impact Model" and record and verify the impact strength of 10 fundamental turning points on asset prices over three months. This training can elevate your opportunity recognition ability to a new dimension.
3. Pattern determines the ending. The core of making small funds bigger is not frequent trading, but a deep understanding of the essence of the market. Only by improving cognition can you be invincible in trading.
Conclusion:
Frequent trading is a path destined for failure, while true success often requires extraordinary vision and understanding. As Soros said in (The Alchemy of Finance): "True excess returns come from cognitive differences, not trading frequency."
I hope this article can help you escape the trap of frequent trading and find your own trading path. Remember, trading is not gambling, but a contest of cognition. Only by constantly improving yourself can you be invincible in the market.
Crypto circle, crypto circle, there must be a high-quality circle.
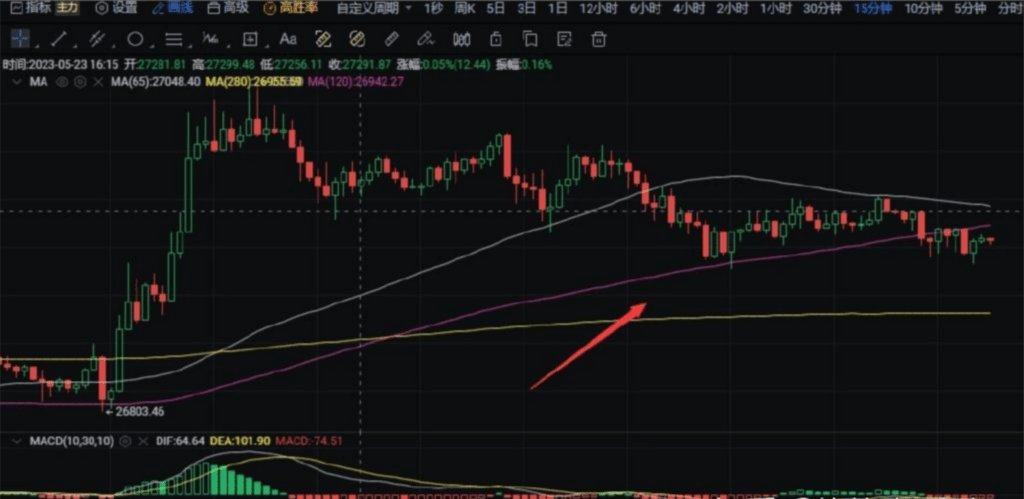
Before talking about MACD, I have to talk about moving averages. There are also many moving average trading methods on the market, which feel very mysterious. Today, let’s reveal the moving average:
What is a moving average?
Moving Average (MA) is the average price over a period of time.
Moving averages are classified into three attributes:
1. Regression
For any target, its price always fluctuates around its value. It will be sold and cashed out when the expected profit target is reached, just like the earth's gravity, it will be pulled back if it deviates, which is what we often say about the deviation rate.
2. Support and pressure
This is also a main reason why many people are obsessed with using moving averages. Moving averages are average costs and the average price in densely traded areas. (Breaking or rushing up are fast, the principle of alternation), it has a strong support and resistance effect, stepping back on the cost has support, breaking through the cost has pressure, just like when driving a car to break through obstacles, it needs to accelerate.
3. Trend
The moving average with a long cycle has continuity, is very stable, and has the function of revealing trends.
The disadvantage of moving averages is that they have serious lag.
The price we see is the appearance, the essence is the value behind the price;
Making decisions based on prices is just the appearance, the core is value, whether it has been accepted and recognized;
In the actual transaction process, retail investors always see price fluctuations, and their emotions will be infected and cause fluctuations.
Long moving averages have stability but lack sensitivity;
Short moving averages have sensitivity but lack stability.
In the actual operation process, the moving average has hidden and pullback attributes, and will face a series of problems. If these problems cannot be solved, it will affect our trading judgment and cause inevitable errors in the results. Can the moving average solve these problems?
What time will it be pulled back? What price will be pulled back? How big is the magnitude of the pullback?
Moving averages cannot solve these key problems,
So it can't help us trade well
These substantive problems must be solved during the trading process. Therefore, in order to fully reveal all price fluctuations, the upgraded upper and lower channels extend to BOLL (Bollinger) channels and MACD.
BOLL (Bollinger) specializes in support and pressure, and MACD specializes in the strength of trends.
A single moving average has obvious limitations, including the moving average system. These are actually basic technical indicators.
Seeing this, do you still think moving averages are mysterious?
Are you still thinking about relying on one trick to make a living?
Any technical indicator is an auxiliary indicator, which can only help us improve the probability of trading.
MACD, which came into being, solved the problems that the moving average core could not solve on this basis,
The core concept of MACD design: secondary processing of data
MACD originates from moving averages, and the collection source of moving averages is the closing price of each K-line, which is a secondary processing of these data, so it will be more accurate and objective.
Just like MACD is highly praised by many retail investors, it has wide applicability, reliable judgment accuracy, relatively accurate trend judgment, and extremely high popularity.
As mentioned earlier, moving averages are lagging in tracking market trends, so in most cases, they are not suitable for short-term trading, especially for contracts. For short-term trading, the support and resistance of Bollinger Bands are more effective. I will share this in later articles with practical examples.
Today, I will talk about the origin of MACD here first. Later, I will talk about the basics, structure, golden cross, dead cross, top and bottom divergence practical application skills of MACD, and the combination of volume and MACD combat methods.
At the end, let's first share the MACD indicator settings, and you will understand why many stock market trading masters are not adapted to the crypto circle;
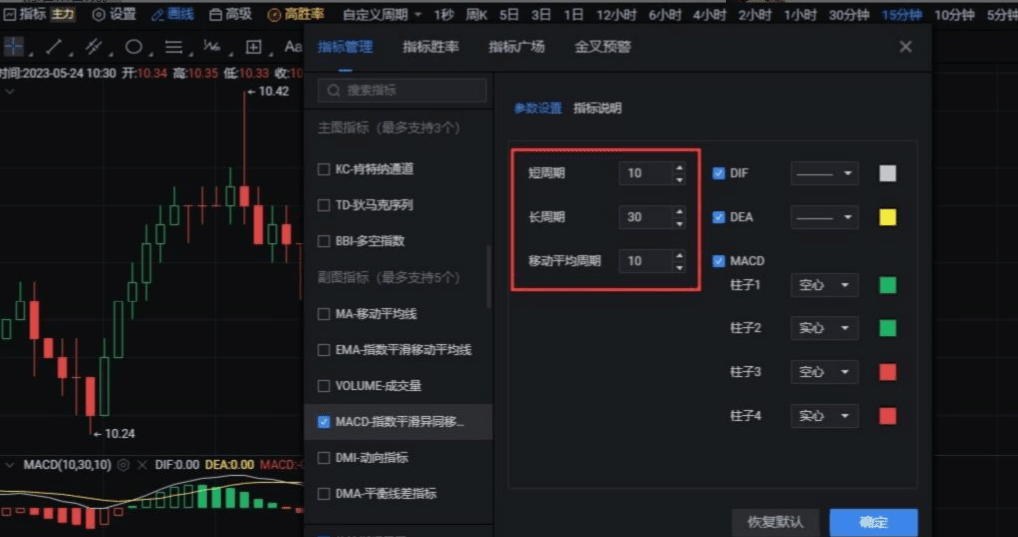
You can compare it with your own MACD settings and you will understand. The crypto circle trades 24 hours a day, 365 days a year, with no rest days. So many indicators are different from traditional financial markets;
Professionalism creates value, details determine success or failure.
So today we will look at the basics of MACD and the structural part of the MACD indicator:
There are four basic parts of the MACD indicator:
1. Study the strength of the trend (trend depth)
2. Explore the change in intensity (trend speed)
3. The MACD histogram can only express that the trend is weakened or enhanced
4. MACD is a lagging indicator (natural attribute, it is a secondary processing of moving average data, and the moving average itself is lagging enough)
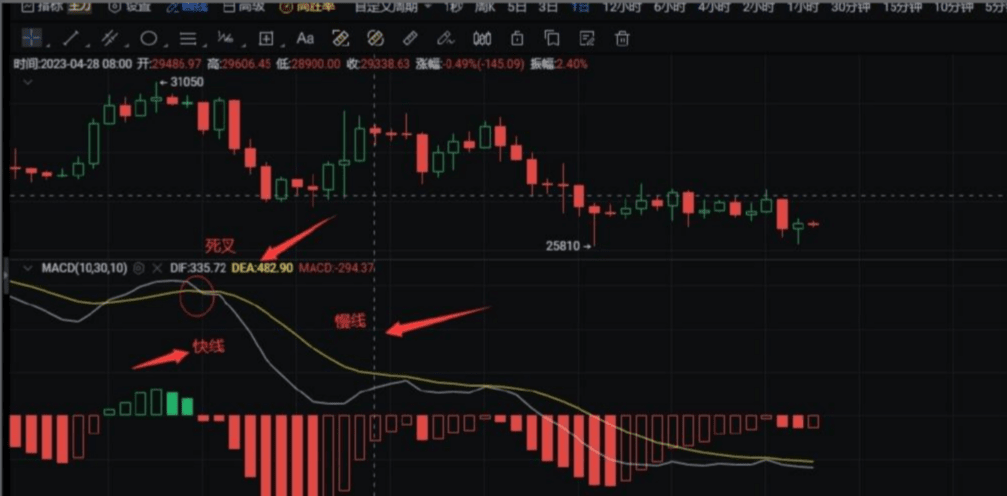
The structural part of the MACD indicator:
Composed of two curves and a set of column lines, the fast-moving one is the DIF line, and the slow-moving one is the DEA, which can also be abbreviated as fast F and slow A;
Fast F represents the short-term rise and fall speed. The larger the gap between the two EMA curves displayed and the higher the curve position, the faster the rise speed. The lower the curve position, the faster the fall speed;
DEA is calculated from DIF using a smoothing moving algorithm, representing the average DIF value over a period of time. DEA is used as an auxiliary judgment line for DIF;
The fast line collection source is the moving average, and the moving average collection source is the closing price, which is a secondary processing of the moving average data;
The slow line collection source is the fast line, which is equivalent to three times of data processing of the moving average;
Fast line minus slow line and then multiplied by 2 to get the MACD.
The column line is also called the MACD line, and the practical technique lies in:
When MACD is above the zero axis, the speed of the rise accelerates or the speed of the fall slows down;
When MACD is below the zero axis, the speed of the rise slows down or the speed of the fall accelerates;
And these laws are:
1. The trend is accelerating,
2. The gravitational return near the zero axis, the column line must return once it deviates too far from the zero axis;
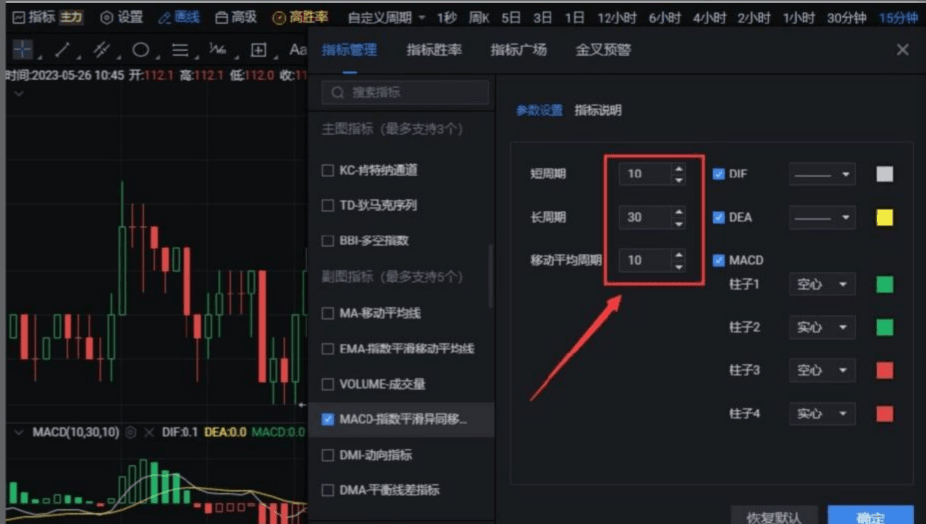
MACD settings:
This setting alone can defeat 99% of analysts who use MACD analysis on the market;
The crypto circle is traded 24 hours a day, 365 days a year. MACD originates from traditional financial markets, and its default setting has market closing periods. So if you don't set it, the probability of accuracy will be greatly reduced, especially for long trading cycles;
You master more clues about the market than others, the basis you draw will be more accurate than others, then your probability of success will be higher,
Operate at the same frequency, watch from the sidelines when there is divergence, and only do the market that you can understand;
Trading, nothing more.
The MACD technical indicator can only be used as one of the reference and auxiliary indicators in our actual combat process. This is the key. We cannot mythologize it through a single technology;
Just like I use candlestick charts to get a general view of the market, determine the bull and bear market, and determine the stage;
We can clearly judge which stage the current trend of the market is in, whether it is in a bull market or a bear market? Which stage of the bull market or bear market? According to the level, is the current market in an uptrend, downtrend or consolidation trend;
If you give the market conclusion 80 points, then if you want to continue to improve the accuracy of your judgment, you need more technical indicators to assist;
MACD indicator plus 5 points, Western technical analysis plus 5 points, Bollinger, volume, etc. The higher the points, the higher the difficulty;
If these indicators are at the same frequency, the probability of success will be greatly increased;
This is also the real reason why you should build your own trading system.
Only when we understand the principle of specific indicators and have a clear understanding in our minds can we use them with ease, and the probability of correctness will be improved.
Later, I will specifically share some practical uses of golden crosses and dead crosses in specific stages of the market, rather than the so-called golden cross buying, dead cross selling, and rigid approaches on the market.
Trading cryptocurrency is trading the heart:
The crypto circle is superficially trading cryptocurrency, but it is actually trading human nature. You can overcome market fluctuations, but you may not be able to overcome your own greed and fear.
Countless people lose money in chasing highs and selling lows, but still fantasize "I can catch it next time"; only a very few people understand: the key to making money is not the market, but oneself.
Remember what the predecessor said——
Control emotions, the market is an ATM.
Instead of asking "Which coin will rise", ask yourself: "Am I ready to be a person who can calmly make money from fluctuations?"
If you are also walking on the path of the crypto world, may this article light a lamp for you.
Control emotions, abide by strategies, endure loneliness, and survive storms, only then are you qualified to stand on the summit of profit takers.
Ten years of sharpening a sword, the above heartfelt words, I hope to guide those who are destined and take less detours. Trading cryptocurrency is not difficult. I have never felt tired, but enjoy it. Just like those who love late-night games, how can they say they are tired?$BTC $ETH #币安HODLer空投TOWNS #加密项目 #加密市场反弹


