In the fast-paced world of cryptocurrencies, every second counts - and every candle tells a story.
Many traders enter the market relying on noise or signals or emotions. They buy late and sell early, wondering why they keep losing. The truth is that technical analysis is the foundation of consistent profitability, and candlestick charts are the first language every serious trader should learn.
This guide will walk you through the basics of reading candles, how to use them for better entry and exit points, and why mastering this simple charting method can significantly reduce your losses in cryptocurrencies.
🔍 What are candlestick charts?
Candlestick charts are visual representations of price movement over a specified time period. Each candle shows four key data points:
Opening price: Where the price started
Closing price: Where the price ended
High price: The highest point reached
Low price: The lowest point reached
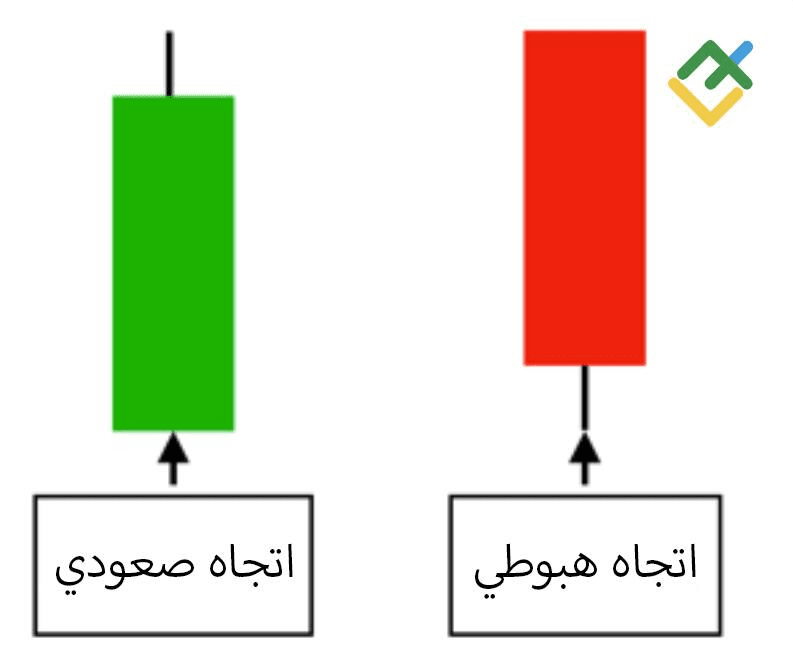
The body of the candle shows the price range between the opening and closing prices. The wicks (or shadows) show the high and low points, indicating how much the price moved during that session.
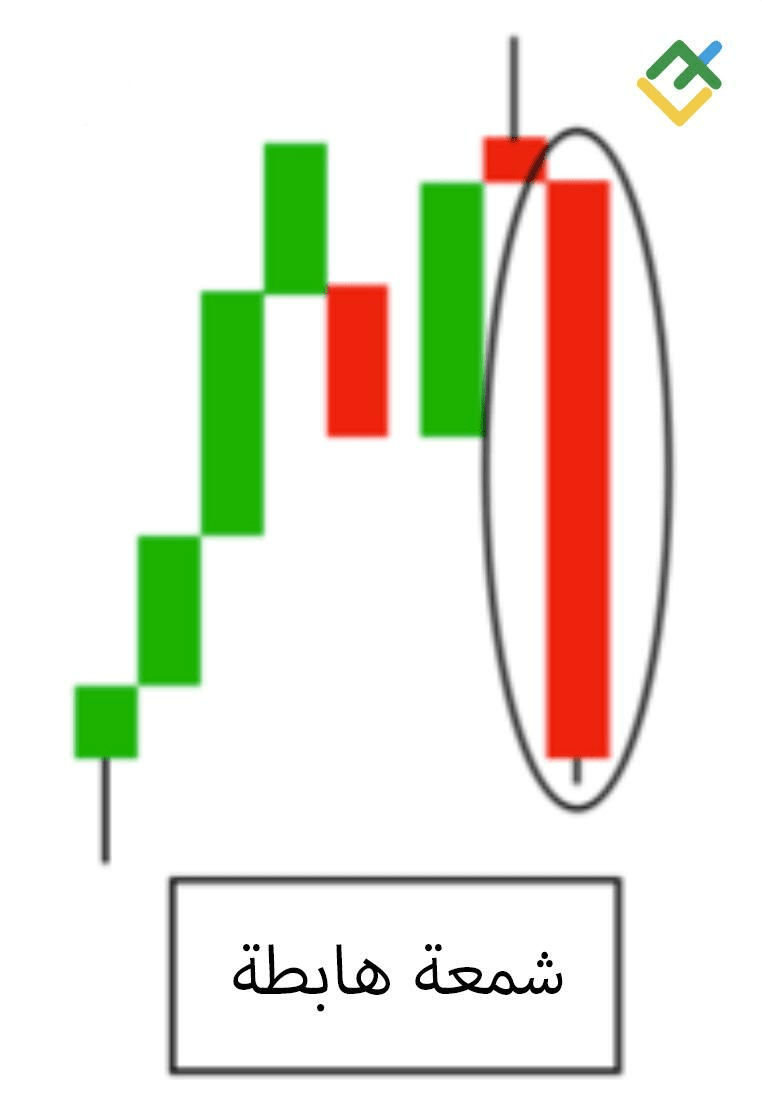
Green (or white) candles show bullish momentum (close > open), while red (or black) candles show bearish momentum (open > close).
Candlestick charts are not just visual tools; they reveal the psychology of market participants. Each candle reflects a struggle between buyers and sellers.
📘 Why candlesticks are important in the world of cryptocurrencies
Unlike traditional markets, cryptocurrencies are characterized by their volatility and fluctuations around the clock, heavily influenced by market sentiment. This makes real-time price movement extremely important. Candlestick patterns provide you with direct information about what is happening behind the scenes.
Benefits include:
Early warnings of trend reversals
Entry signals based on momentum confirmation
Exit strategies when exhaustion is detected
Support and resistance analysis with price reaction zones
When used correctly, candlestick patterns provide clarity in chaos - and help you act with confidence instead of fear.
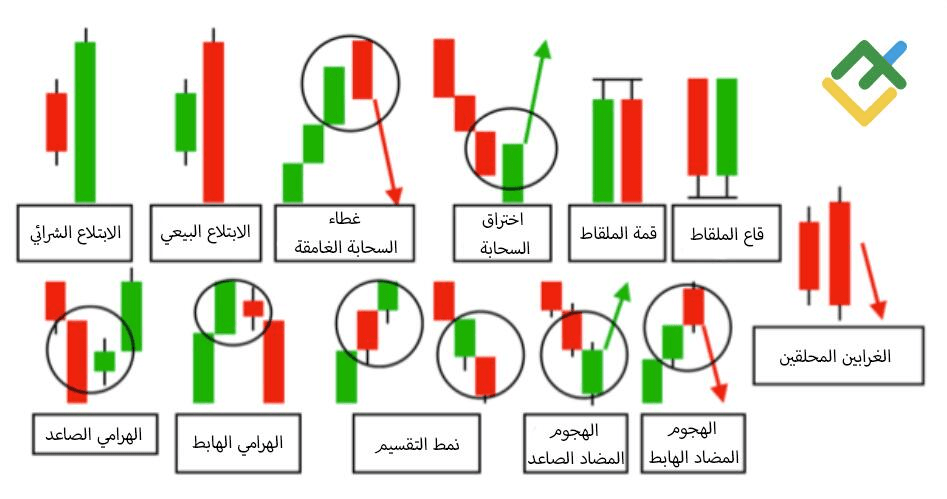
🔑 The top 7 candlestick patterns every cryptocurrency trader should know
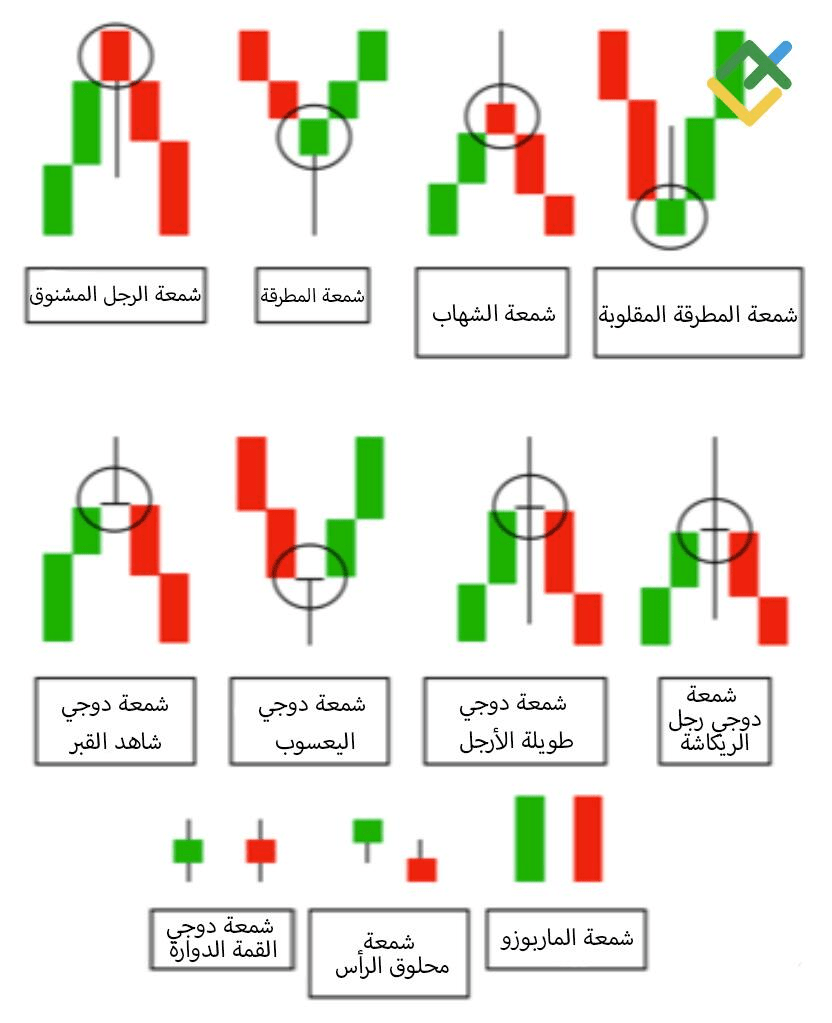
1. Hammer and Inverted Hammer
A hammer pattern forms after a downtrend, with a small body and a long lower wick. It indicates a potential bullish reversal.
The inverted hammer is similar, but with a long upper wick. It is also a bullish signal after a downtrend.
2. Shooting Star and Hanging Man
A shooting star appears after an uptrend, with a small body and a long upper wick. A bearish reversal signal.
The Hanging Man is its bearish twin, often appearing at the top of an uptrend.
3. Doji
When the opening and closing prices are close together, it indicates indecision. It is stronger when an engulfing candle appears.
4. Bullish and Bearish Engulfing
A larger candle fully engulfs the previous candle. This indicates strong buying momentum (bullish) or strong selling momentum (bearish).
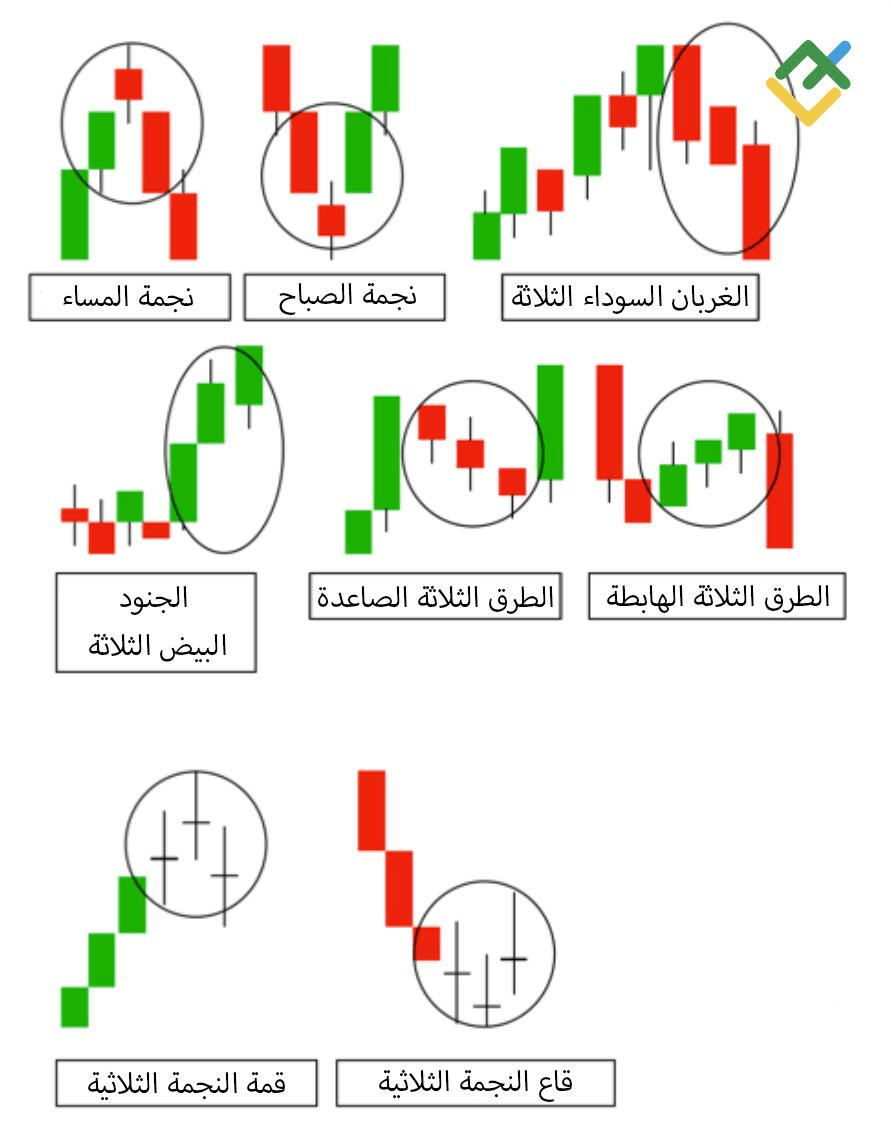
5. Morning Star and Evening Star
Multiple candle formations indicate a reversal.
The Morning Star is bullish, and the Evening Star is bearish.
6. Three White Soldiers / Three Black Crows
Strong continuation patterns.
Three large bullish (or bearish) candles confirm a trend in motion.
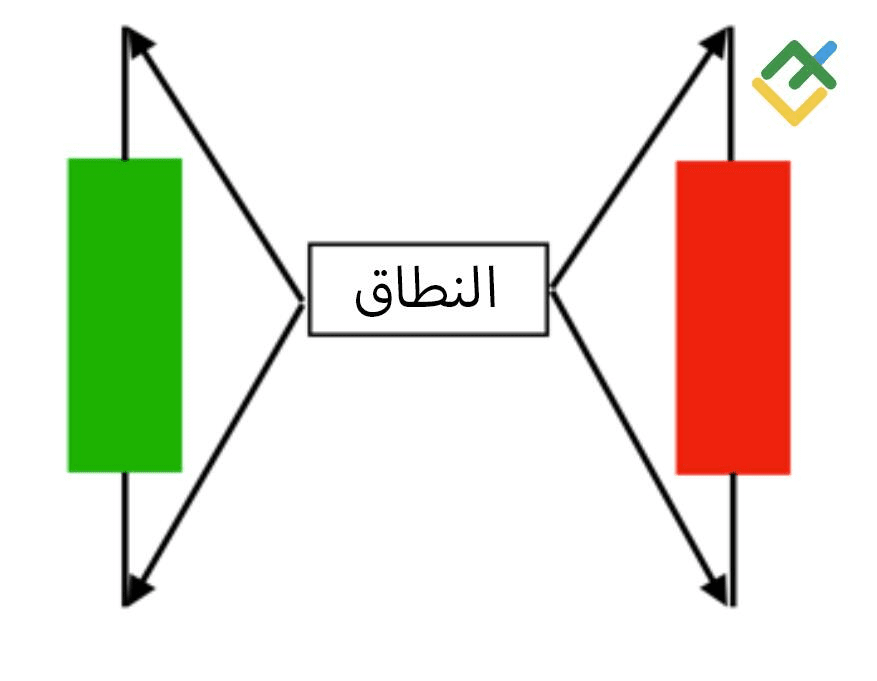
7. Inside Bars and Outside Bars
Inside bar: Consolidation. Wait for a breakout.
Outside bar: A change in momentum. Watch for trend acceleration.
Each of these patterns becomes stronger when combined with support/resistance areas, volume analysis, and trend context.
🧠 How to use candlestick patterns in real trades
To reduce losses and increase win rates, follow this simple process:
1. Identify the trend
Is the market moving in an upward, downward, or sideways direction? Candle behaviors differ in each direction.
2. Look for patterns at key levels
Watch for reversal signals at key support and resistance levels. Patterns like hammers, engulfing candles, or stars near these levels may indicate an ideal entry point.
3. Wait for confirmation
Do not trade based on just the candle. Wait for trading volume, its structure, or breakouts to confirm the pattern.
4. Defining managed risk trades
Use the candlestick structure to identify precise stop-loss points. For example, a stop-loss just below the hammer wick.
5. Avoid overtrading
An increase in patterns does not mean an increase in trades. Focus on high-probability trades within a strong market structure.
⚠️ Common mistakes to avoid
Even the best candlestick readers can fall into traps. Watch for the following:
Imposing patterns where none exist
Trading on a single candle without confirmation
Ignoring the broader market structure
Over-reliance on candlestick patterns in low-volume environments
Remember: Candles are powerful - but only when used as part of a complete trading plan.
✅ Final thoughts - why you won't trade blindly again
Learning candlestick patterns won't guarantee overnight success - but it will give you the insight that most traders lack.
Instead of reacting, you will act based on evidence. Instead of chasing pumps, you will anticipate them. And instead of falling into the fear of missing out traps, you will recognize when smart money enters or exits.
The best part? You don't need expensive tools or indicators, just the desire to observe, learn, and practice.
Start by learning candles today, and treat each trade as a calculated step
#TrumpTariffs #FOMCMeeting $BTC $BNB