📊 Comprehensive Analysis:
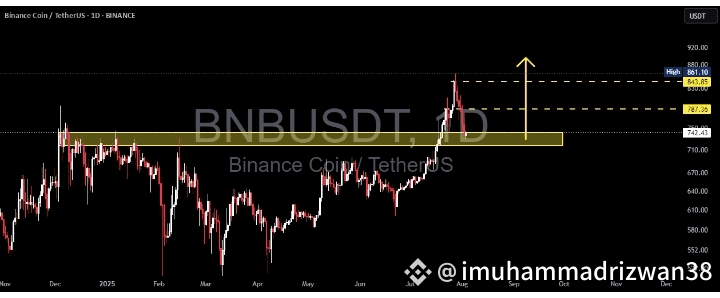
BNB/USDT has finally managed to break out of a major consolidation range that lasted over 6 months, with the key resistance zone between $730 and $750 acting as a strong ceiling since late 2024.
The breakout in late July 2025 was supported by a noticeable increase in volume, signaling strong accumulation and a possible shift from a ranging market to a bullish trend.
Now, the price is revisiting this previous resistance — a crucial retest zone that will likely determine whether this move is sustainable or a potential bull trap.
🔍 Key Price Levels Identified:
🟡 Retest Support Zone (Previous Resistance):
$730 – $750 → A critical area that must hold to maintain the bullish market structure.
🟡 Minor Resistance:
$787.36 → Recently rejected, this is the next short-term barrier that bulls must break.
🟡 Major Resistance (Swing High):
$843.85 → Key historical level before reaching the recent local high.
🔵 Recent Local High (Potential Double Top or Breakout):
$861.10 → A break above this level could open the doors to fresh highs.
✅ Bullish Scenario:
If BNB holds above the $742.36 level and prints a strong bullish reversal candle (e.g., pin bar or bullish engulfing), the retest can be considered successful.
Next upside targets:
🎯 $787.36 → Immediate resistance
🎯 $843.85 → Key swing high
🎯 $861.10 → Local high
🎯 $900 psychological level → If momentum and volume persist
Look for decreasing volume during retracement and surging volume on breakout to confirm bullish continuation.
❌ Bearish Scenario:
If the price fails to hold above $742.36 and breaks down below $730, this may confirm a false breakout (bull trap).
Downside targets could include:
⚠️ $710 – $690 → Minor demand zone
⚠️ $660 – $640 → Historical support within the previous range
A bearish confirmation would come from a lower high formation followed by a strong bearish breakdown candle with increasing volume.
📈 Chart Pattern & Price Structure:
The breakout indicates a bullish continuation pattern.
Potential formation of a Bullish Flag or an Ascending Channel, if support holds and consolidation continues above $740.
No major signs of distribution yet — the structure remains healthy and bullish.
🧠 Strategic Summary:
The market has shown strong bullish intent, but it is now at a critical retest phase. Holding this zone could ignite the next leg up. Failure to do so, however, may signal a reversal or deeper correction.
For swing traders, the $730–$750 zone is a golden pocket for potential entries with tight risk management. For conservative traders, a confirmed breakout above $787–$843 offers a safer opportunity.
#BNBUSDT #BNBAnalysis #CryptoBreakout #Altcoins #TechnicalAnalysis #PriceAction #SupportResistance #BullishScenario #BearishScenario #CryptoTrading #BinanceCoin #SwingTrading
