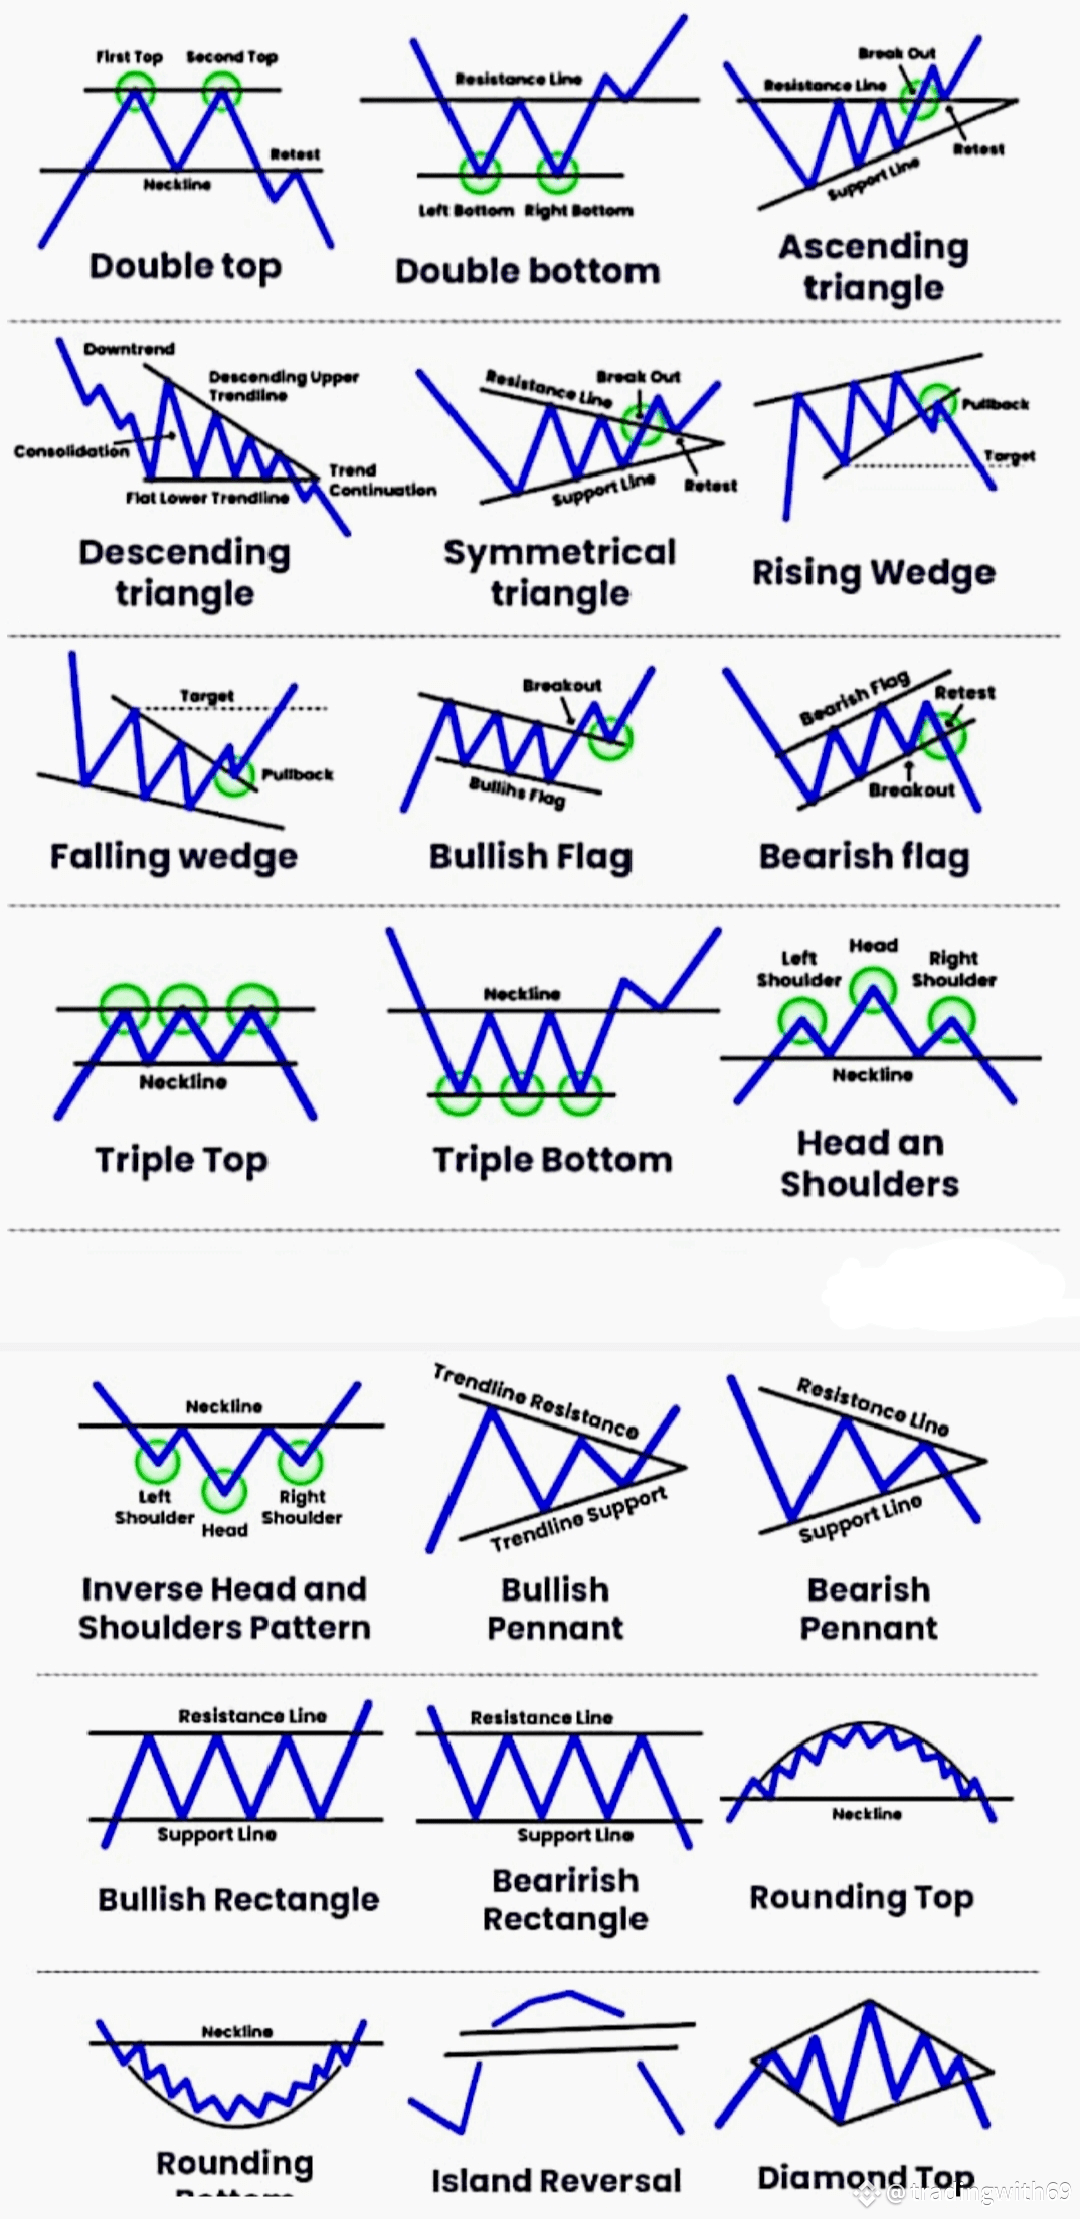
1. Double Top
Bearish pattern: Two peaks at resistance → signals a reversal to the downside.
2. Double Bottom
Bullish pattern: Two troughs at support → signals a reversal to the upside.
3. Triple Top
Bearish pattern: Three failed highs → reversal downward expected.
4. Triple Bottom
Bullish pattern: Three failed lows → breakout upward expected.
5. Head and Shoulders
Bearish pattern: Center peak (head) between two smaller peaks (shoulders) → trend reversal down.
6. Inverse Head and Shoulders
Bullish pattern: Inverted version → trend reversal up.
7. Rounding Top
Bearish reversal pattern with a rounded shape → downtrend likely.
8. Rounding Bottom (Cup shape)
Bullish reversal pattern → strong uptrend may follow.
9. Island Reversal
Reversal pattern with a gap before & after price cluster → sharp trend change.
10. Diamond Top
Rare bearish reversal pattern → signals major top and breakdown.
📈 Continuation Patterns (Trend carries on)
11. Ascending Triangle
Bullish continuation: Flat top resistance, rising support → breakout expected.
12. Descending Triangle
Bearish continuation: Flat support, descending resistance → breakdown expected.
13. Symmetrical Triangle
Neutral/breakout pattern: Consolidation with tightening range → breakout either way.
14. Bullish Flag
Continuation: Small downward consolidation after a strong uptrend → continuation up.
15. Bearish Flag
Continuation: Small upward consolidation in a downtrend → continuation down.
16. Bullish Pennant
Similar to flag: Tight range after strong move up → breakout higher.
17. Bearish Pennant
Similar to flag: Tight range after strong drop → breakdown lower.
18. Rising Wedge
Bearish pattern: Higher highs/lows converging → breakdown likely.
19. Falling Wedge
Bullish pattern: Lower highs/lows converging → breakout upward.
20. Rectangle (Bullish & Bearish)
Sideways consolidation: Breakout direction depends on overall trend.
🕯️ BONUS: Candlestick Patterns You Listed (Different from Chart Patterns)
These include:
Doji, Hammer, Hanging Man, Morning/Evening Star, Engulfing, Harami, Marubozu, Belt Hold Line, etc.
These are short-term candle-based signals, not full price structures like the image patterns.
#CandleStickPatterns #tradingStrategy #TechnicalAnalysis #DayTradingTips #tradingforbeginners