In the world of trading—whether crypto, forex, or stocks—chart patterns are powerful tools that can help traders make informed decisions. These patterns are visual representations of price movements and can signal whether an asset is likely to go up, down, or continue in the same direction. Mastering them can greatly improve your profit potential.
Let’s break down how you can turn chart patterns into profitable trades using the Chart Pattern Cheatsheet.
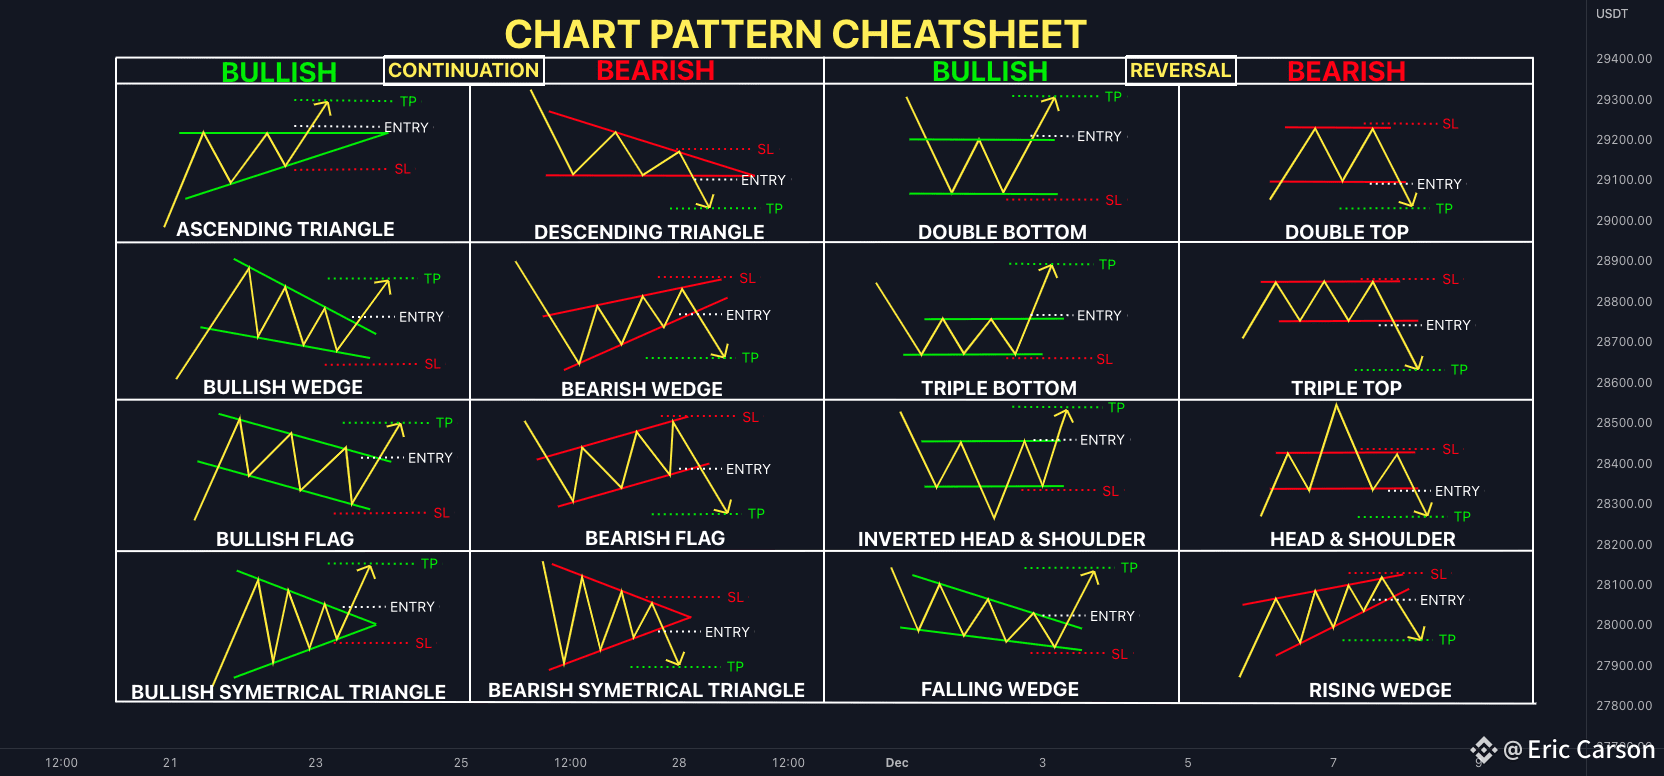
🔁 Chart Patterns Are Divided into Two Categories:
✅ Continuation Patterns
These suggest that the current trend will likely continue.
🔁 Reversal Patterns
These indicate that the trend is likely to reverse.
🚀 BULLISH PATTERNS – Profit from Upward Moves
When you spot these patterns, it often means prices are likely to rise, giving you a buying opportunity.
📈 Continuation (Bullish):
Ascending Triangle
📌 Strategy: Buy at breakout.
🟢 Entry: Above resistance
🔴 Stop-Loss (SL): Below the last low
✅ Take-Profit (TP): Equal to triangle height
Bullish Flag / Wedge / Symmetrical Triangle
🪄 These patterns follow a strong uptrend and show temporary consolidation before continuation.
🔼 Breakout = Buy Signal
🔁 Reversal (Bullish):
Double Bottom / Triple Bottom
✅ After downtrend, these patterns form a 'W' or triple bounce, signaling an upcoming rise.
Inverted Head & Shoulders
👤 Classic reversal sign with 3 dips; middle one is the deepest.
🚀 Breakout of neckline = Go Long
Falling Wedge
🔽 Downtrend with narrowing price action
📈 Breakout to upside = Buy Signal
📉 BEARISH PATTERNS – Profit from Downward Moves
These patterns show a high probability of price dropping, ideal for shorting or exiting positions.
📉 Continuation (Bearish):
Descending Triangle
🔴 Breakdown of support level = Short entry
📍 SL above last lower high
🎯 TP = Height of the triangle
Bearish Flag / Wedge / Symmetrical Triangle
🔻 These follow a downtrend and break down for further drops.
🔁 Reversal (Bearish):
Double Top / Triple Top
⛔ After uptrend, forms ‘M’ shape or triple resistance rejection
🚨 Breakdown of neckline = Sell Signal
Head & Shoulders
👤 Opposite of inverted head & shoulders
🔽 Breakout of neckline = Entry for Short
Rising Wedge
🔺 Looks bullish but usually ends with a downward breakout
📉 Enter short when price breaks support line
🔧 How to Use These Patterns for Real Profits
✅ 1. Identify the Pattern:
Zoom out on your chart and match the price action with the cheatsheet.
✅ 2. Wait for Confirmation:
Don’t trade just because a shape “looks right.” Wait for breakout or breakdown with volume.
✅ 3. Set Stop-Loss and Take-Profit:
Never trade without risk management.
SL protects your capital
TP ensures you lock in gains
✅ 4. Backtest & Practice:
Use demo accounts or small positions to get confident with real setups.
💡 Final Thoughts
Chart patterns are like roadmaps for traders. They don’t guarantee profits, but they increase your chances significantly when used correctly with proper risk management.
🔁 Combine chart patterns with volume analysis, indicators like RSI or MACD, and trendlines to make even better decisions.
🎯 Consistency, discipline, and patience are the keys to turning chart patterns into real profits.
#ProjectCrypto #TrumpTariffs #MarketPullback #Write2Earn #Write2Earn!