Get ready, brave adventurers of the financial market! Tired of the market mocking your portfolio? Fed up with buying just before everything crashes? Fear no more! Chart patterns are here to save the day, or at least help you lose money in a more strategic way.
Imagine that the market is an endless teenage drama, full of emotional ups and downs. Chart patterns are like the secret notes that the characters pass in class: they give us clues about what's going to happen.
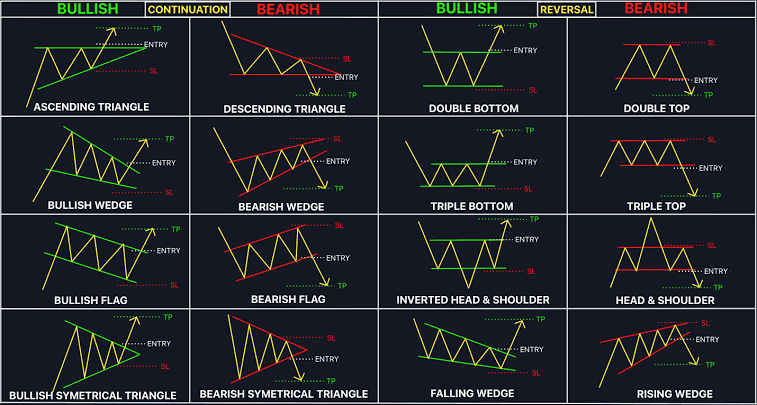
🚀 Bullish Patterns: Buy as if the Apocalypse Were Buying!
When you see these patterns, it's as if the market is about to scream: "We're going up, baby!". The signal is clear: it's time to whip out your credit cards and get ready for the party.
* What to look for: Triangles, flags, double bottom, triple bottom, and those things that look like the letter 'W' or the inverted 'M' (but with a touch of seriousness).
* Strategy: Buy on the breakout. Place a Stop-Loss (the panic button) in case the market decides it was just a bad joke, and a Take-Profit (the profit goal) so you don't get trapped in greed.
📉 Bearish Patterns: Run, Fools!
These patterns are the signal that the party is over and the police are on the way. The market is crashing and it's time to run for the hills, or rather, to enter a short position (sell).
* What to look for: Triangles, flags, double top, triple top, and those that look like the letter 'M' or the inverted 'W' (but this time seriously).
* Strategy: Sell on the breakout. Place a Stop-Loss so you don't get blown away if the market has second thoughts, and a Take-Profit to collect profits before it's too late.
♻️ Reversal Patterns: The Plot Twist
These patterns are like the unexpected twist at the end of a movie. Suddenly, everything you thought you knew turns upside down. A market that was going up crashes, or vice versa.
* Examples: Double bottom, double top, head and shoulders. These are the patterns that scream: "Surprise! Nobody saw this coming!".
🤑 7 Tips to Avoid Being a Walking Trading Joke
* Don't rush, impatient one! Wait for confirmation. The market is not your Tinder date; it's not going to give you an instant "like".
* Plan, plan, plan. Set your entry and exit points before emotions turn you into a wreck.
* Manage risk. If you're risking $1, aim to gain at least $2. If not, you're playing Russian roulette with your money.
* Use additional tricks. Confirm your moves with volume and other indicators. If the volume is low, it's like the market is whispering, and no one whispers important things.
* Practice with fake money. Don't be a hero. Use a demo account to learn. It's better to make mistakes with fake money than with the money you need to pay rent.
* Forget small time frames. Patterns on 5-minute charts are as reliable as a weather forecast in Venezuela. Stick with the bigger ones, like 1H or 4H.
* Don't overtrade. Quality is better than quantity. Be selective.
In summary, chart patterns are like a guide to deciphering the chaotic world of trading. If used well, they will help you spot good opportunities, avoid stupid decisions, and, with a little luck, keep your portfolio from looking like a battlefield.
Now, trade with more brain and less heart! Which of these patterns do you think is the easiest to spot?