#TrumpTariffs ### 🔍 **Technical Analysis: CFX/USDC (Short-Term)**
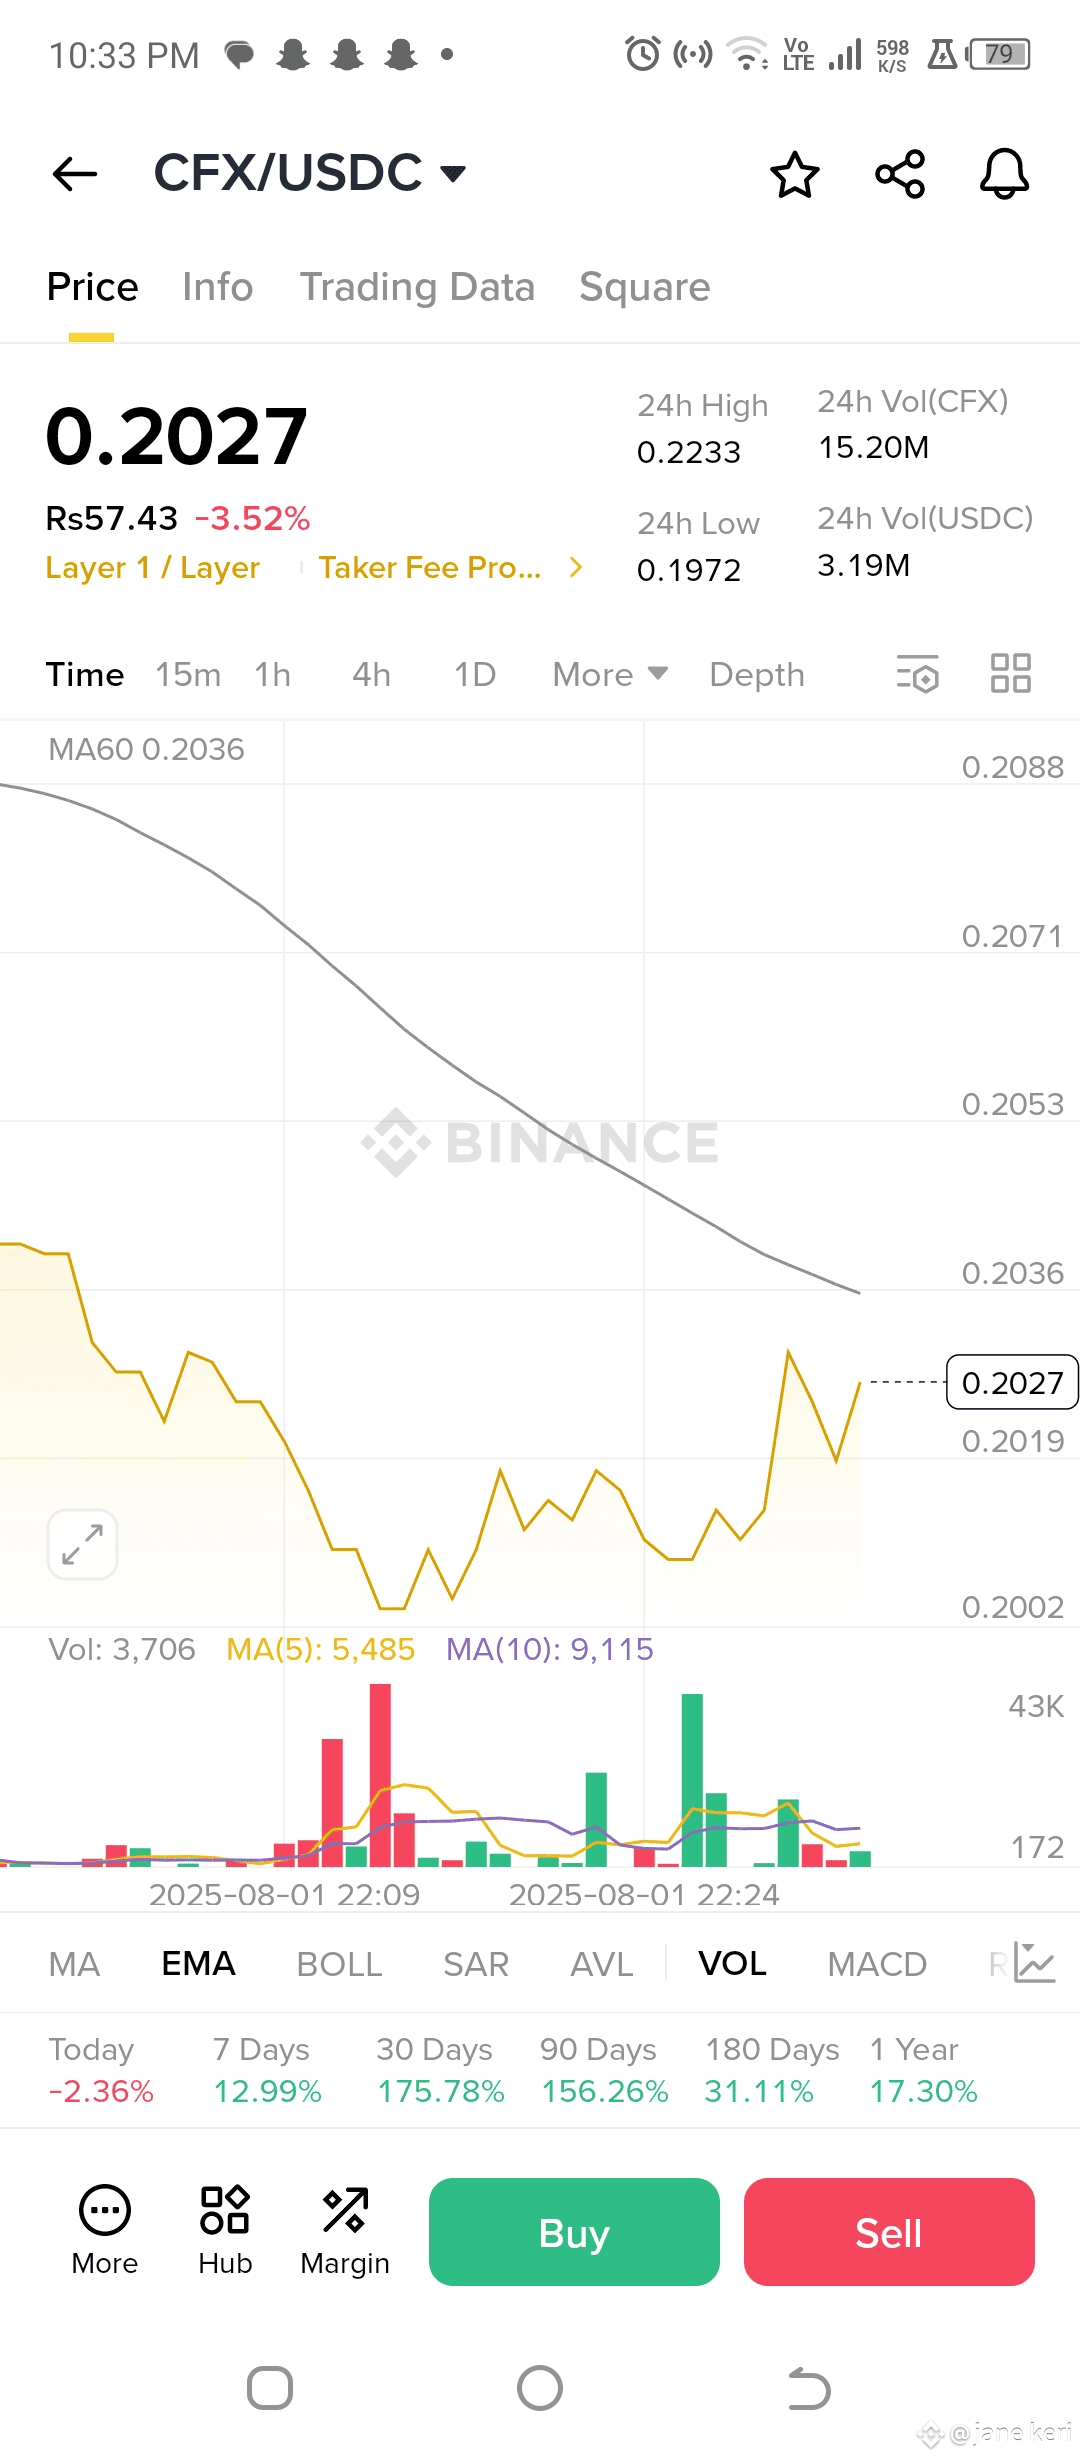
**Current Price:** \$0.2027
**24h Change:** -3.52%
**24h High/Low:** \$0.2233 / \$0.1972
**Trend:** Short-term **downtrend** with signs of minor recovery.
---
### 📉 **Chart Signals**
1. **Moving Averages (MA60 at 0.2036):**
* Price is **below MA60**, confirming a **bearish bias**.
* Indicates the recent momentum is weaker than the 60-period average.
2. **Volume:**
* Spike in **red candles with high volume** shows **strong selling pressure**.
* Recent green bars show **some recovery attempts**, but not enough to reverse the trend.
3. **Support & Resistance:**
* **Support:** \$0.1972 (24h low).
* **Resistance:** \$0.2036 (MA60) and \$0.2053.
---
### 🧭 Trade Signal Evaluation
* **Trend:** Downtrend.
* **Recovery attempt** is visible but weak — lower highs.
* Current price action suggests a **bearish-to-neutral** market.
---
### 📌 Trade Plan
#### ✅ If You're Planning to **Buy (Long)**:
* **Entry:** Around \$0.2020–\$0.2030 (if confirms support).
* **Stop Loss (SL):** \$0.1965 (below 24h low to limit loss).
* **Take Profit (TP):**
* TP1: \$0.2070 (near short-term resistance).
* TP2: \$0.2120 (higher bounce level if momentum builds).
> Risk-Reward: \~1:2, which is acceptable for short scalps.
---
#### ❌ If You're Already **in the Trade**:
* Entry near **\$0.2030–\$0.2050** means you're at a slight **loss** now.
* Monitor price near \$0.1972 (if broken = exit trade).
* Consider averaging only if strong bounce with volume.
---
### 📊 Summary
| Factor | Signal |
| ---------------- | -------------------------------------------------------- |
| Trend | Bearish |
| Volume | Mixed |
| Momentum | Weak recovery |
| Suggested Action | Wait for breakout above \$0.2036 or bounce from \$0.1972 |
| SL | \$0.1965 |
| TP | \$0.2070 / \$0.2120 |
--- #MarketPullback #SECProjectCrypto $CFX