🔵 DOT | Multi-Timeframe Analysis (Spot / Long Term)
📆 General Context:
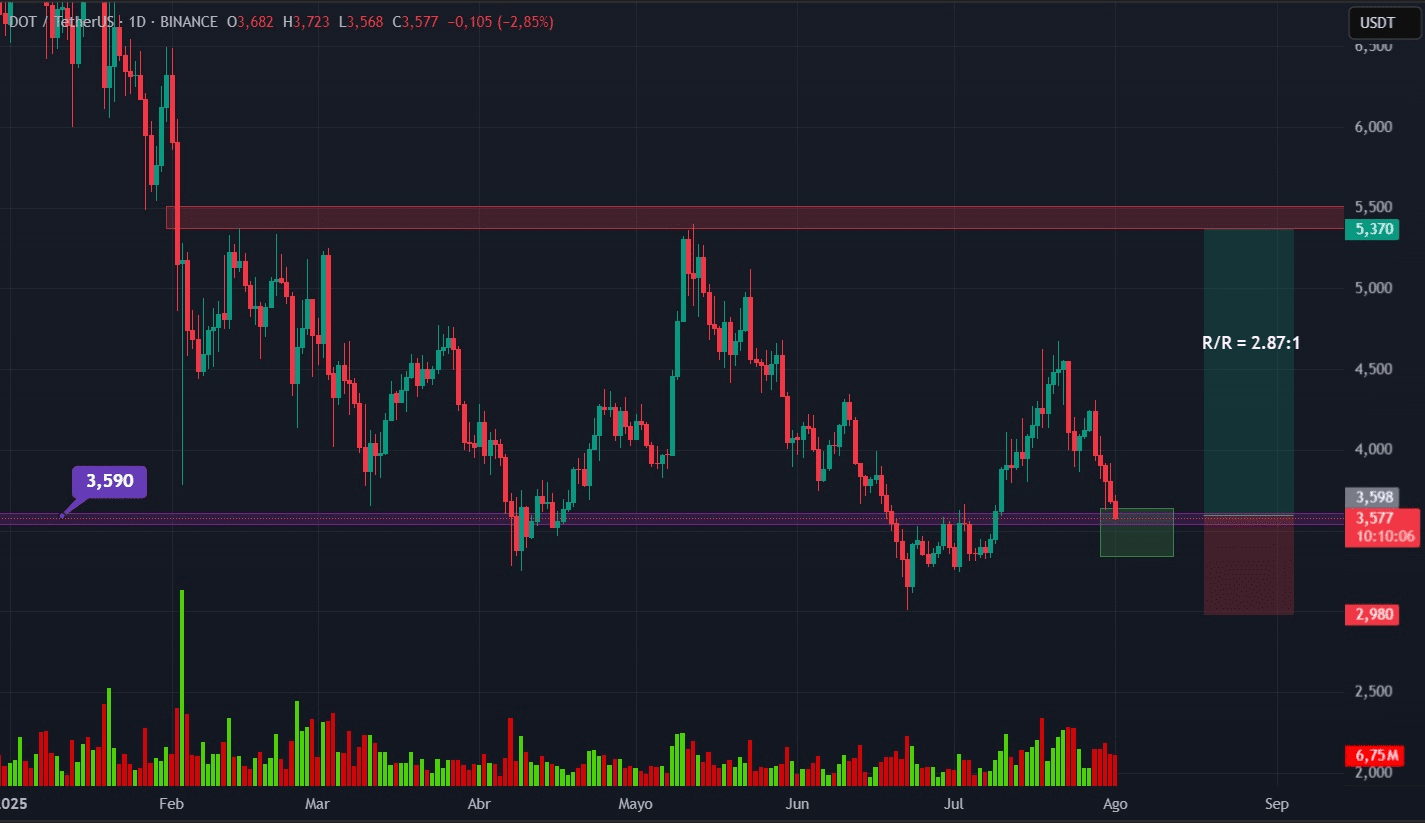
Polkadot (DOT) remains within an accumulation zone in the 1-week and 1-day time frames, respecting key supports.
Additionally, the price is approaching a relevant support zone from 2020, where significant rebounds previously occurred.
This historical level reinforces the thesis that DOT could be forming a technical floor before a new impulse.
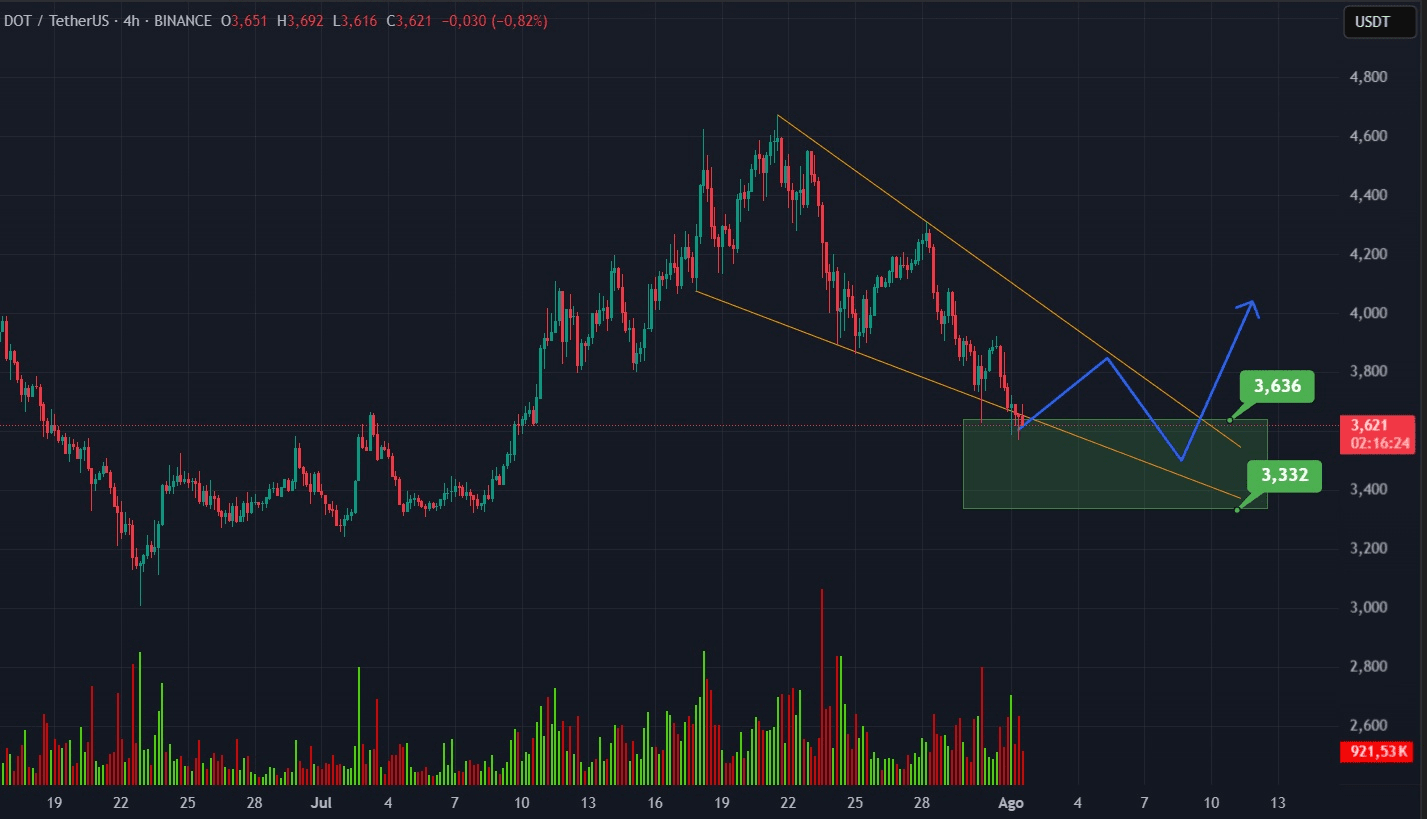
📉 4H Chart:
In 4-hour time frame, DOT is entering a strategic buying zone, within a falling wedge — a typically bullish pattern.
In addition, its entry into the Fibonacci reversal zone 0.618 – 0.88 is a critical area where upward reactions usually occur.
🔄 Strategy for holders (spot):
✅ Gradually repurchase what was sold at higher zones
✅ Ideal for accumulating with a long-term perspective
✅ Suggested profit-taking:
📍 Medium term: 4.57 USDT - 5.37 USDT
🚀 Long term: 10.5 USDT - 15 USDT – 20 USDT
📌 Suggested entry zone:
💰 Between 3.636 and 3.332 USDT
🛑 Optional stop-loss: ⛔️ 2.98 USDT (adjustable according to your risk tolerance)
🧠 Technical aspects in favor:
• Decreasing volume = possible seller exhaustion
• Ordered correction within the wedge
• Confluence of key supports + historical technical zone (2020)
📌 In summary:
DOT presents solid technical conditions for a spot entry. We are at a zone where historically the price has reacted strongly.
Time to act calmly, with a long-term vision and a clear strategy.
⚠️ Disclaimer:
The ideas and analyses I share about these assets are personal and part of my own trading approach. They do not represent an investment recommendation or financial advice.
My intention is solely to share my vision with the community, as just one opinion among many, for educational and informational purposes. Each person is responsible for their decisions in the market.
#dot #Polkadot #Spot #AccumulationZone #altcoins