Position: Long
Join our live session to get the latest market insights, expert analysis, and real-time updates.
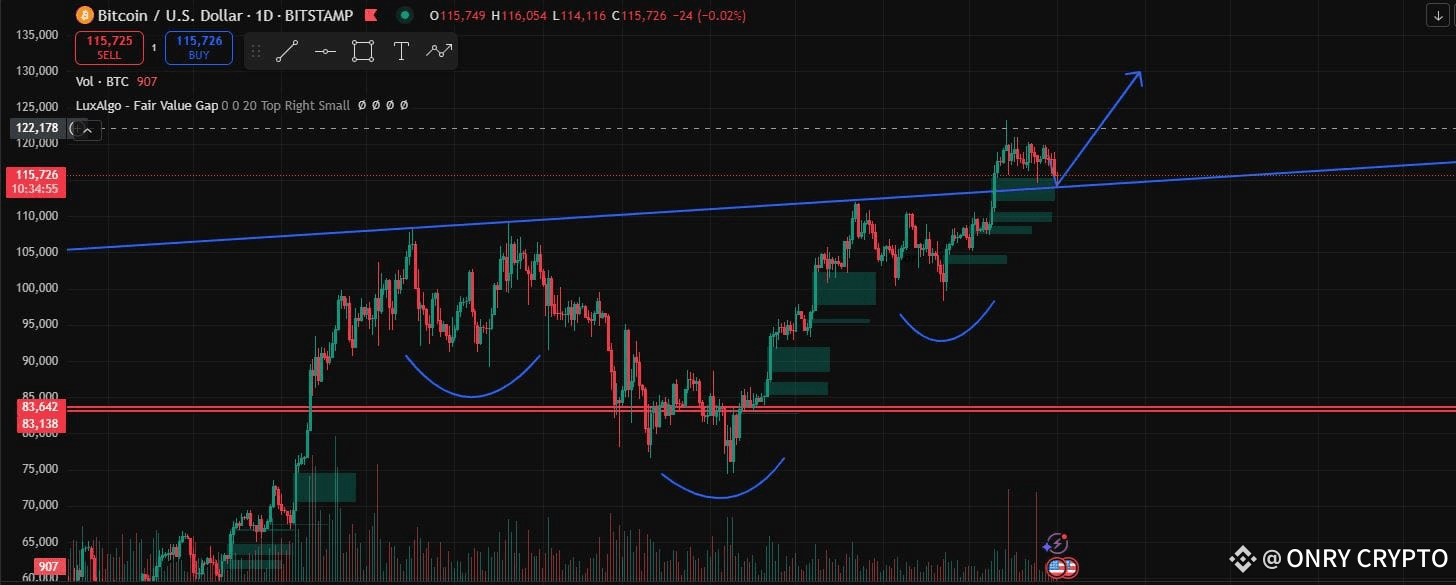
Hope you can see this BTC chart. This BTC Chart shows a clear inverse head and shoulders pattern with 3 bottom. After breaking above the neckline (blue trendline), Bitcoin is retesting this level as support. typically signaling a bullish reversal.
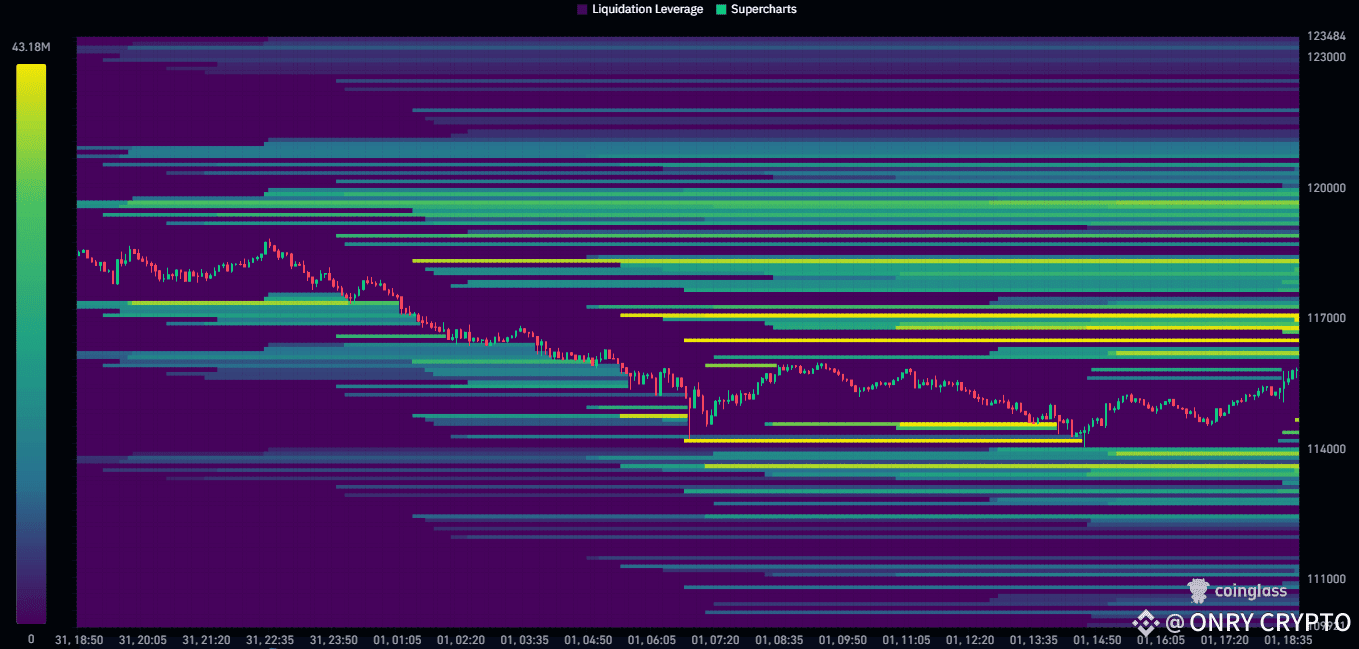
This is a liquidation heatmap showing BTC price action with liquidation levels. Yellow zones represent high liquidation interest, indicating potential areas of price reaction. BTC falling sharply, then consolidating between ~$114K and $117K. A breakout above the yellow bands could trigger more liquidations and rapid price movement.
Join our live session to get the latest market insights, expert analysis, and real-time updates.
Trade setup:
Entry Price : Market Price
Target Price:
1. 117.200
2. 119.311
3. 122.199
Leverage: 5x
#Write2Earn #BTC走势分析