In the cryptocurrency market, which operates 24/7 and has volatility far exceeding traditional financial markets, K-line charts serve as 'holographic recorders' of price fluctuations, making them an essential analytical tool for every trader. Compared to traditional markets like stocks, the high leverage characteristics and frequent extreme conditions in the crypto space further highlight the core value of K-line analysis in risk control and opportunity capture. This article will systematically dissect the composition logic, classic patterns, and practical techniques of K-lines, helping traders establish a scientific technical analysis framework.
The essence of K-lines: A visual language of price competition.
The K-line originated from rice trading during the Tokugawa shogunate in 17th century Japan and has evolved over hundreds of years to become a universal technical analysis foundation in global financial markets. In crypto trading software, each K-line encapsulates the price competition process within a specific time period: the body represents the fluctuation range between the opening and closing prices, with a bullish line (usually red) indicating the closing price is higher than the opening price, and a bearish line (usually green) indicating the opposite; the upper and lower wicks record the highest and lowest prices within that period, reflecting the boundaries of contention reached by both bullish and bearish parties.
The choice of time period directly determines the analytical dimension: short-period K-lines such as 1 minute and 5 minutes are suitable for intraday high-frequency trading, capturing short-term volatility opportunities; 4-hour and daily K-lines are often used for trend judgment and are core references for medium to long-term layouts; while weekly and monthly lines can reveal macro cycle turning signals. In the unique 'coin age' concept in the crypto space, the daily K-lines of mainstream coins often hold more analytical value than the weekly K-lines of altcoins, closely related to the project's market depth.
Single K-line: An instant snapshot of market sentiment.
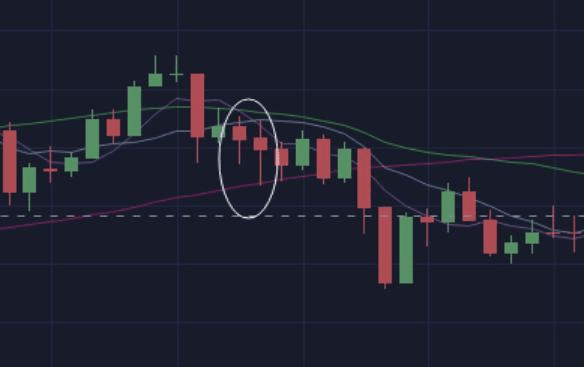
The shape characteristics of a single K-line can intuitively reflect the short-term balance of bullish and bearish forces, with three key patterns needing special attention: a spinning top (short body, long wicks) indicates a stalemate between buyers and sellers, with volatile prices ultimately returning to the origin, often seen before trend reversals; a no-wick candlestick (no upper or lower wicks) indicates strong unilateral power, with bullish candlesticks representing overwhelming buying pressure, while bearish ones suggest heavy selling pressure; hammer and hanging man patterns (small body, lower wick longer than twice the body) are potential reversal signals, where a hammer appearing at a low often indicates the formation of a bottom, while a hanging man at a high signals caution against pullback risks.
In practical trading within the crypto space, the validity of a single K-line must be verified by trading volume. For example, when Bitcoin breaks through a key resistance level, if accompanied by trading volume far exceeding the average, it indicates that the buying power is real and credible, thus enhancing the effectiveness of the breakout; conversely, a large bullish candlestick without volume may indicate a trap set by the main force, with a higher probability of a subsequent pullback. Especially in the futures market, large liquidations often leave abnormal K-line patterns, which need to be judged comprehensively in conjunction with data like funding rates.
Combination Patterns: The Pathway Code of Trend Evolution.
When multiple K-lines form specific combinations, they can reveal more complex trend evolution logic. The engulfing pattern is one of the most reliable reversal signals in the crypto space: during a bear market, a large bullish line completely engulfs the previous bearish candlestick's body, indicating a strong counterattack from the bulls; while the bearish engulfing pattern appearing during a bull market signals that the bears are beginning to dominate the market. It is important to note that the greater the difference in the body of the engulfing pattern and the longer the trend cycle it is in, the higher the probability of a reversal.
Continuation patterns help identify trend persistence, such as 'flag formation' and 'triangle convergence' during an upward process, often indicative of the main force washing out positions, with a high probability of continuing the original trend after consolidation. In altcoin speculation, 'three white soldiers' (three consecutive small bullish lines) often appear at the early stages of a rally, while 'three black crows' (three consecutive small bearish lines) may signal a selling point. The performance of these patterns varies significantly between mainstream coins and altcoins, requiring dynamic adjustments of judgment standards based on market capitalization.
Indicator Coordination: Building a Multi-Dimensional Verification System.
Relying solely on K-line pattern analysis has limitations and needs to be combined with technical indicators for cross-validation. Moving averages (MA) can smooth short-term fluctuations, with the golden and dead crosses of 5-day and 10-day short-term moving averages with 20-day and 60-day medium to long-term moving averages being classic signals for judging trend reversals; the relative strength index (RSI) is used to identify overbought and oversold conditions, with an RSI above 70 typically seen as overbought and below 30 as oversold, but in extreme market conditions, indicators may become dull.
The combination of Bollinger Bands (BOLL) and K-lines is particularly effective in volatile markets: when prices touch the upper band, they often face resistance and retreat, while touching the lower band makes it easier to rebound; when the Bollinger Bands constrict and then suddenly open, accompanied by K-line breakout patterns, it often signals the start of a significant market movement. The divergence phenomenon of the MACD indicator serves as a warning for trend exhaustion, wherein prices reach new highs while the MACD does not synchronize with the rise, forming a top divergence, necessitating caution against pullback risks.
Unique K-line Analysis Rules in the Crypto Space.
The uniqueness of the cryptocurrency market requires traders to establish adaptive analytical logic. Under the influence of leverage, the wicks of candlesticks in the crypto space are often longer, and K-lines with daily fluctuations exceeding 20% in extreme market conditions are not uncommon, which necessitates setting stricter stop-loss levels; the characteristics of funding rounds lead to irregular movements in altcoin K-lines, and for coins with a market capitalization below $100 million, K-line analysis should be used cautiously in conjunction with the project's fundamentals.
During the transition of bull and bear cycles, K-line patterns exhibit obvious regularity: at the beginning of a bull market, bullish lines with 'bottom volume' often appear, while the mid-term is characterized by 'shallow pullbacks and short timeframes', and the top often accompanies a bearish engulfing pattern with 'volume stagnation'; rebounds during bear markets are mostly 'shrinking bullish lines', making it difficult to form a sustained trend, while bottom confirmation requires K-line combinations that 'test the bottom multiple times without new lows'.
Risk Warning: Boundaries and Limitations of Technical Analysis.
Although K-line analysis is an important tool, the non-regulatory characteristics of the crypto space determine its inherent limitations. The phenomenon of major players controlling the market is common, with some project teams creating false signals by 'painting K-lines' to deceive retail investors; sudden news (such as policy regulation or technical vulnerabilities) can have a far greater impact on prices than technical aspects. For example, the cryptocurrency ban in China in 2021 led to a 17% drop in Bitcoin in a single day, making it difficult for any technical pattern to predict such black swan events in advance.
Rational traders should use K-line analysis as a decision-making reference rather than the sole basis, combining fundamental research (project technological progress, ecological construction) and capital data (net inflow and outflow of exchanges, changes in major holdings) to form a comprehensive judgment system. In the highly volatile crypto market, establishing a 'technical signal filtering + position management + stop-loss discipline' integrated trading system is far more important than simply mastering K-line patterns.
From the emotional interpretation of a single K-line to trend analysis of multi-period patterns, the core value of K-line analysis lies in helping traders understand the logic of market competition. However, technical tools ultimately serve human decision-making, and in the uncertain field of cryptocurrency, maintaining a sense of awe and continuously iterating knowledge is the fundamental guarantee for navigating bull and bear markets. When every fluctuation on the K-line chart can be reasonably explained in market terms, traders can truly achieve the transition from 'looking at lines' to 'understanding the market.'
\u003cc-100/\u003cc-101/\u003cc-102/\u003e