I believe many traders have heard of the Wyckoff Method and Wyckoff Trend Analysis. This article will systematically guide you
Understanding the core concepts of Wyckoff theory and sharing how to integrate it into practical trading techniques.
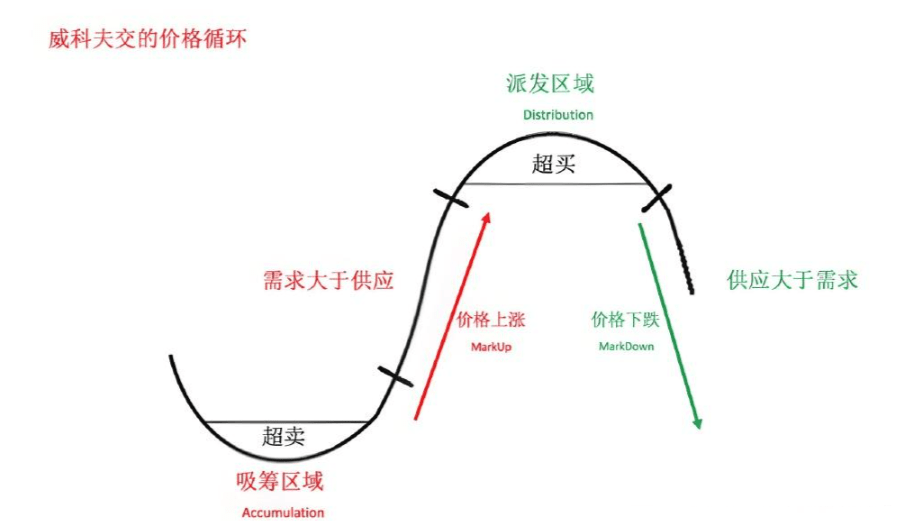
The Wyckoff method is an important analytical tool in the trading field, its core lies in the division of market trend phases, which can help traders identify patterns.
This method divides market trends into several key phases:
Accumulation phase after a downtrend: price moves sideways, with doubts about the downtrend. The 'spring effect' here, that is, the price's false breakout of the support level failing, indicates that the downtrend will reverse.
Uptrend phase: Price breaks through the accumulation range, and the upward trend is initiated.
Distribution phase after the uptrend: upward momentum weakens, price enters a range, and large funds prepare for the next step. The 'spring effect' in this phase, that is, the price's false breakout of the new high in the range, is a good opportunity to add short positions, as well as a trap for baiting bulls.
Downtrend phase (Markdown)……
Wyckoff Study #1: Retracement
When I study trading concepts or share my strategies, I primarily focus on those non-textbook patterns. Price movements rarely follow completely according to
the textbook's perfect pattern development, so being exposed to various different chart cases will be very helpful for actual trading.
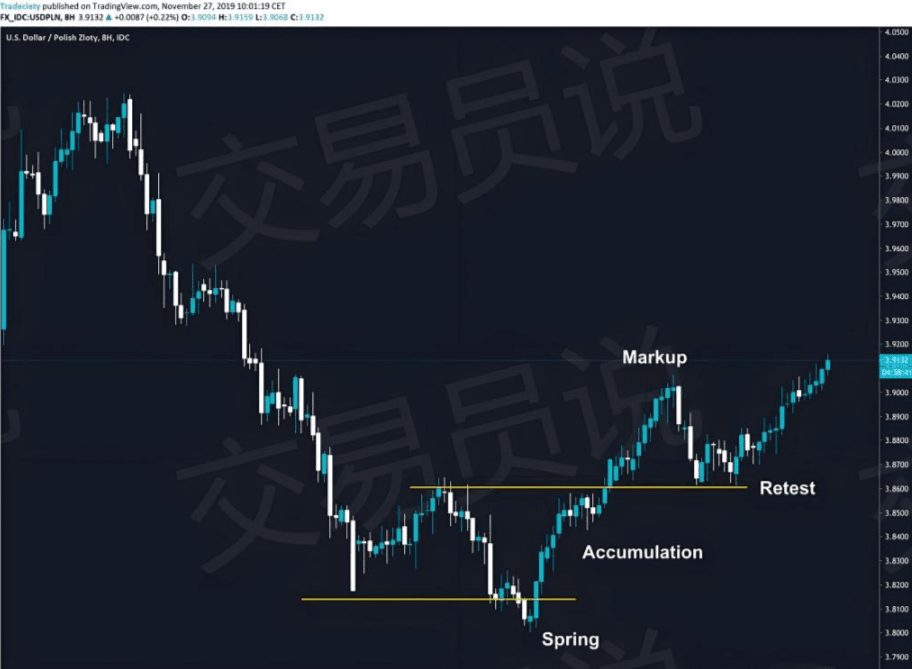
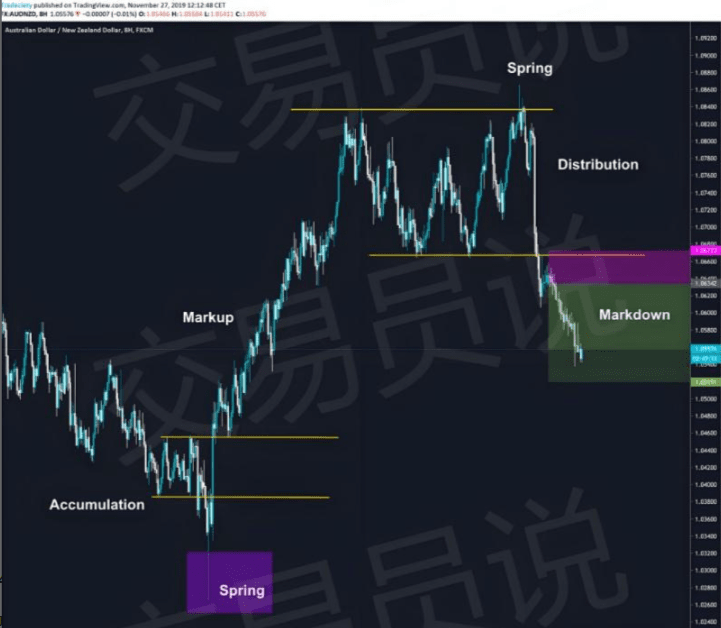
The screenshot below shows a perfect pattern of a decline followed by accumulation and a false breakdown rebound (Spring).
At the bottom, the price briefly breaks below the previous low but does not continue the downward trend. Notice that the bearish K-line during this potential 'false breakdown'
is very small and lacks conviction, while the subsequent bullish candlestick is stronger and has a longer body. This already hints that this breakdown attempt
is very weak.
Then the price broke out and rose for a period, before starting to retrace. Many traders will enter when the breakout occurs and move their stop losses up
to the breakeven point. This behavior is very common in the market, so we often see retracements happening. This retracement accurately hit
return to the previous breakout level triggered all stop-loss orders, while also providing an opportunity to buy again at a lower position.
Price action before the breakout
This analysis, although a bit off-topic, is absolutely worth a look. Before the price truly breaks through the accumulation/distribution range, a special retracement structure often forms, which I call 'lower bounce'.
Ask yourself again, what does this reveal about the comparison of bullish and bearish forces:
In the consolidation range, the bears have significantly pressed the price down to support (as seen by the large bearish candlestick). Then the bulls attempted to intervene and push the price higher but failed, and the price did not even approach the previous high. This is a very critical signal indicating that the market is still dominated by bears. Therefore, the subsequent bearish breakout is a logical result.
You will find that this pattern often appears before many successful breakouts, so you might want to consider this 'low-level rebound' as a resonating factor in your trading considerations.
Wyckoff Study #2: Confirmation
Sometimes, the 'spring effect' can appear in the form of a single pin bar. The key point is: this 'spring' must break below the prior low to fully confirm that this is a failed breakout attempt.
As shown in the figure below, the accumulation phase forms within a clearly defined sideways range and there is a horizontal resistance level. Before the official breakout, the price has started to form higher lows, which is an especially important bullish resonance signal, particularly when it appears after the spring effect, indicating that buying pressure is accumulating.
In this case, the retracement appeared immediately, which again reveals why the 'break-even stop-loss' strategy is not the best choice. Although traders believe that such stop-losses can 'protect' positions, in most cases they actually make holdings weaker during price retracements.
Once the retracement is confirmed, the price then enters the upward phase.
Wyckoff Study #3: Non-textbook Accumulation and Distribution
Let us continue exploring those non-textbook accumulation and distribution phases.
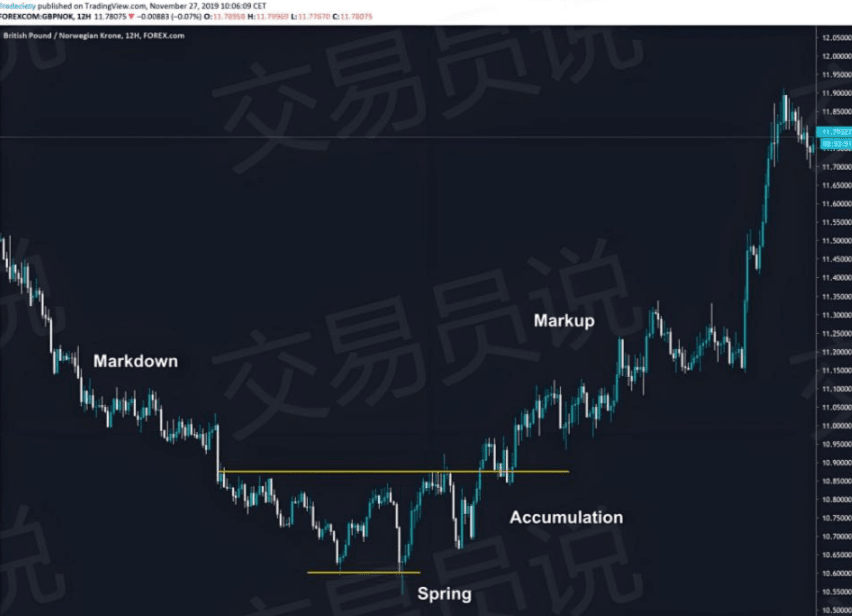
In the left side of the following image, the price did not form a long-term horizontal accumulation area, but we can clearly observe that the price is in a downtrend
was followed by stagnation. Moreover, before the accumulation began, the price did not show a significant strong downward movement but rather a slow decline.
This has already suggested that this round of the downtrend is not strong. If a reversal occurs after a relatively weak downtrend, then a new round of
upward trends are generally stronger.
The spring pattern is also very strong, further indicating that market forces are about to change. After the spring's failed breakdown, a non
Consistently strong bullish candlesticks.
So far, we have found multiple resonance signals indicating that the upcoming bullish trend may succeed. It is very important to confidently trade
such a system, stacking these resonating factors is crucial. The more hints we can find, the stronger the confidence in the trade.
After the breakout, the market immediately retraced and formed a retracement pattern. This is a very important market pattern that is very worthy of in-depth study.
study.
In the right image, you can see a trade I still hold (this trade had reached its take-profit target at the time of publication). I traded from
Breakout of the distribution area. This 'spring' is a pin bar candlestick that breaks all previous highs. The distribution area consists of a very clear
The precise definition of horizontal support levels. Compared to trend lines, horizontal support levels require less subjective judgment, making it easier to time trades.
This breakout is also accompanied by a retracement.
Wyckoff Study #4: Wyckoff and Divergence Signals
Divergence is an excellent trading analysis tool that perfectly fits with Wyckoff theory and trend analysis. Although I have explored divergence multiple times, in short, divergence indicates that the current trend momentum is waning.
As we have seen in previous chart studies, the core of Wyckoff trend analysis is interpreting trend structure and trend strength.
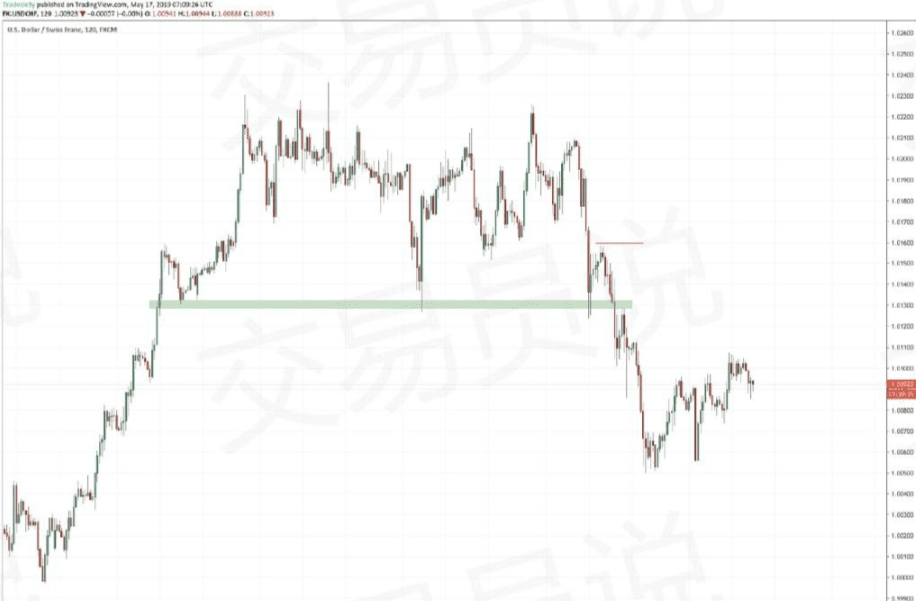
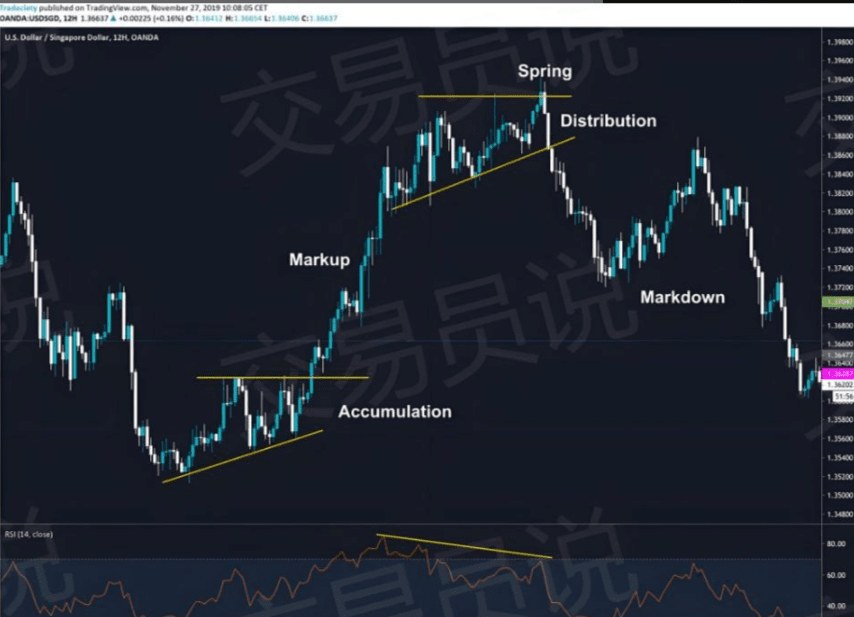
In the following situation, the distribution phase occurs when there is divergence in the RSI indicator. Although this distribution is not a perfect horizontal consolidation pattern, we can clearly see that the uptrend is losing momentum. The trend waves gradually become shorter, and the price struggles to make new highs. At the top, the spring pattern manifests as a failed breakout, followed by a rapid reversal downward in price.
After the spring, the bearish candlestick suddenly becomes strong and significantly elongated, further confirming the shift in bullish and bearish forces. The bears are clearly ready to take over the market.
The markdown phase did not achieve immediate success, but the price retraced back to the breakout area.
Wyckoff Study #5: The Spring Pattern and the Cooperative Application of Bollinger Bands+
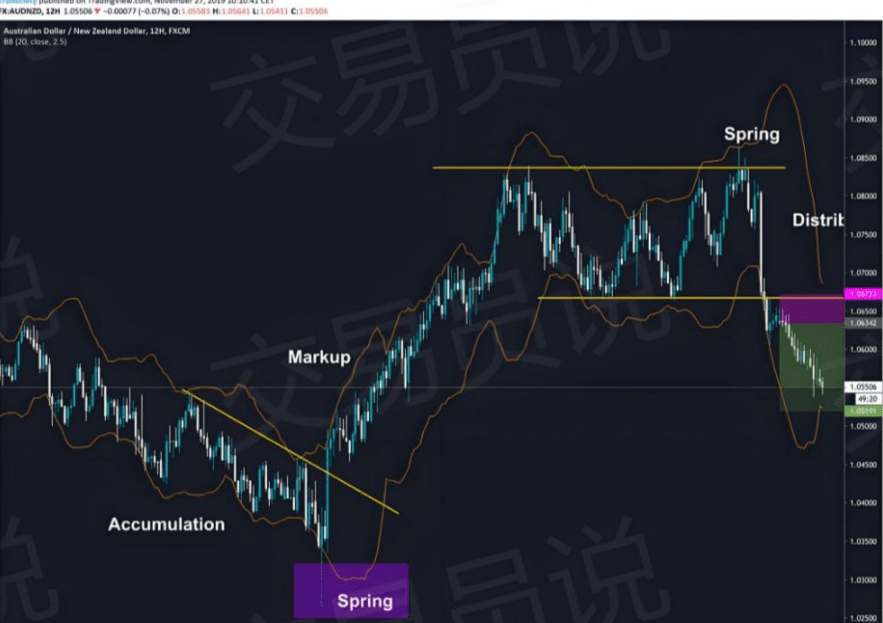
When identifying important spring patterns, Bollinger Bands are an excellent tool. Bollinger Bands are essentially a standard deviation indicator measuring price volatility, meaning that when the price breaks outside the Bollinger Bands, it often signals significant market events. 95% to 99% of price fluctuations occur within the Bollinger Bands channel.
If the price can significantly break through the outer Bollinger Band, it will be more meaningful. When the price crosses the outer Bollinger Band significantly, it should particularly catch your attention. In the example below, the 'spring' on the left shows a very strong spike crossing the Bollinger Band outward. We have discussed this chart situation earlier, but when combined with Bollinger Bands, we can treat it as another resonating factor in our toolbox.
The stronger the breakout (spike), the higher the probability that the trend will actually reverse if all other resonating factors confirm the trend analysis.
If you are also a technical enthusiast researching technical operations in the cryptocurrency space, you might want to pay attention to @加密大师兄888 , you will gain more insights!