Ripple $XRP corrects after the rally: -18% from the high. July closes up 35%. The RSI is oversold, with technical support under observation.
After the rally, the price of Ripple (XRP) has also begun to crunch , recording three consecutive days of decline. It is currently trading at $2.9850 and is down 7.70% on the week.
💥Ripple closes July up 35%
However, the price is retracing 18% from the monthly high recorded at 3.665 USDT. Ripple's performance since the beginning of 2025 stands at +43%, with a market cap of $ 177 billion . This increase follows the +237% with which it closed 2024. Considering the performance starting from November 2024 , XRP has recorded a +515% rally in 8 months.
💥Historical overview of the rally on a monthly chart
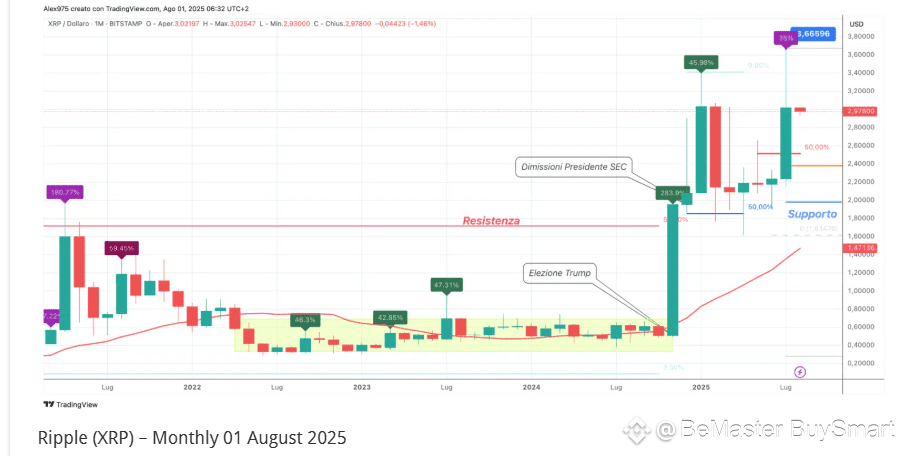
Ripple's rally in recent months is clearly visible in the attached monthly chart . The historical overview of the last four years shows a long corrective phase, but above all, a period of prolonged congestion , which affected the asset from May 2022 until the bullish explosion in November 2024. This momentum led XRP to a first high in January 2025, in the $3.40 area.
💥Correction between February and April 2025
After the January high, Ripple entered a correction phase, closing February at -29.33%. The price tested the $1.85 support area, breaking it in April with a low of $1.6184 . A rebound began from that level, but it was accompanied by uncertainty, as evidenced by the monthly candlestick closes.
💥Long-term supports
The monthly chart view also shows two major long-term supports : the first is in the $2.38 area, while the second is in the $1.98 area. July's acceleration has restored strength, but confirmation over the coming months will be important.
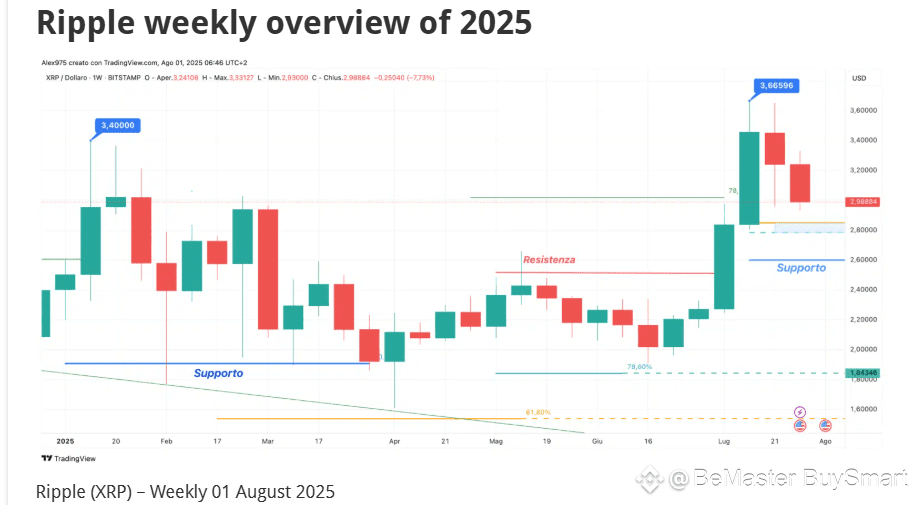
On Ripple's weekly chart, we can observe the price trend over the course of 2025. The January high of $3.40 was followed by a corrective phase that led to the April low of $1.6184.
From that low, a rebound phase began which brought the price back to the resistance area of $2.50 , followed by a retracement and then a breakout at the beginning of July , culminating in a bullish acceleration up to the new high at $3.664.
💥Breakout in July and retracement
The last two weeks have shown bearish signs. The correction from the high is currently 18%, and the price is moving back toward the first vector support of the movement from the April low to the July high. The first support area is between $2.84 and $2.785 . Further down, we find the main support at $2.60. Losing this level could open a deeper corrective phase.
💥XRP: Analysis of the movement from June to July
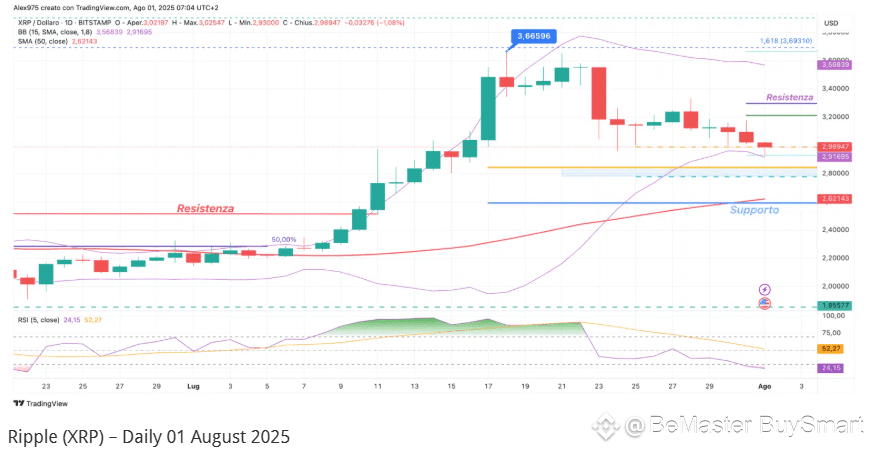
The daily chart provides an overview of the upward movement that began in June, reaching the July high, and the current retracement phase. The price is resting on short-term support in the $2.98 area, but the main range remains the one already indicated between $2.84 and $2.785.
💥Gradual weakness and pressure on the RSI
The decline over the past week has been relatively mild. The weakness is also confirmed by the RSI indicator , which, as highlighted in the July 24 analysis , is showing signs of weakening. Since yesterday, it has entered the oversold zone: a signal that should be interpreted as the potential start of a bearish phase, not an automatic reversal.
💥SMA50 and key resistance at $3.30
Ripple is currently still far from its SMA50, which is in the $2.59 area. The next few days and next week will be crucial. Currently, the resistance level at $3.30 is the key level for a positive signal.
🚀🚀🚀 FOLLOW BE_MASTER BUY_SMART 💰💰💰
Appreciate the work. 😍 Thank You. 👍 FOLLOW BeMaster BuySmart 🚀 TO FIND OUT MORE $$$$$ 🤩 BE MASTER BUY SMART 💰🤩
🚀🚀🚀 NOT JUST LIKE BUT, CLICK FOLLOW BE MASTER BUY SMART - Thank You.

