In the trading world — whether in crypto, stocks, or forex — success depends on timing, analysis, and discipline. One of the most powerful tools in a trader's toolkit is the recognition of chart patterns.
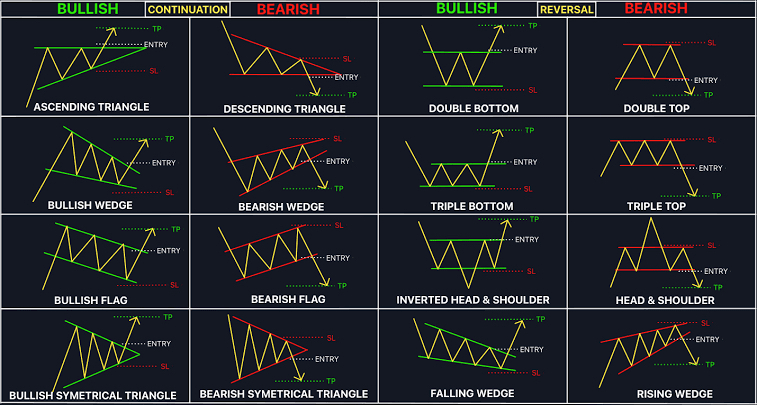
The chart you provided shows 16 powerful chart patterns — categorized as Bullish, Bearish, and Reversal Patterns. If you understand and apply this correctly, they can significantly increase your profit potential while minimizing losses.
🔍 What Are Chart Patterns?
Chart patterns are visual representations of market psychology — showing how buyers and sellers are behaving. These patterns repeat over time and help traders predict future price movements.
🚀 Bullish Patterns – Buy on Breakout!
Bullish patterns signal a potential upward movement. Traders should look to enter long positions (buy) as soon as the pattern is confirmed.
Chart examples:
Ascending Triangle
Bullish Wedge
Bullish Flag
Bullish Symmetrical Triangle
Double Bottom
Triple Bottom
Inverted Head and Shoulders
Falling Wedge
🛠 Strategy:
Entry: After a breakout above the resistance
Stop-Loss (SL): Below the last bottom or recent structure
Take-Profit (TP): Use the previous high or the projection of the pattern's target
📉 Bearish Patterns – Get Ready to Sell
Bearish patterns indicate a potential downward movement. You should look to enter short positions (sell) when the breakout is confirmed.
Chart examples:
Descending Triangle
Bearish Wedge
Bearish Flag
Bearish Symmetrical Triangle
Double Top
Triple Top
Head and Shoulders
Ascending Wedge
🛠 Strategy:
Entry: After a confirmed breakout below the support
Stop-Loss (SL): Above the last top or recent structure
Take-Profit (TP): Use previous low or measured move
♻️ Reversal Patterns – Capture Trend Changes
Reversal patterns form when the market changes direction — from bullish to bearish or vice versa. Identifying them early can help you enter at the beginning of a new trend.
Examples:
Double Bottom → Bullish Reversal
Double Top → Bearish Reversal
Inverted Head and Shoulders → Bullish Reversal
Head and Shoulders → Bearish Reversal
📈 How to Maximize Profits Using These Patterns
Here are 7 essential tips:
1. Wait for Confirmation
Never trade just by "guessing" a pattern. Always wait for a breakout or clear break with good volume.
2. Define Your Entry, SL, and TP in Advance
Each pattern on the chart shows:
Entry point (after the breakout)
SL (red dotted line — stop loss)
TP (green dotted line — take profit)
This ensures risk management and profit definition.
3. Use the Risk-Reward Ratio (RRR)
Always look for trades with a minimum RRR of 1:2, meaning if you risk $10, aim for a profit of $20.
4. Combine with Volume & Indicators
Confirm breakouts with increased volume, RSI, MACD, or moving averages.
5. Conduct Tests Before Real Trades
Practice these patterns on historical charts or demo accounts before risking real money.
6. Stick to Higher Timeframes
Patterns on higher timeframes (1H, 4H, Daily) are more reliable than on 5M or 15M.
7. Don't Overtrade
Trade only high probability setups. Quality over quantity.
💡 Final Considerations
Chart patterns give you a technical edge in the market. When combined with discipline and proper risk management, they help you:
Identify trades early
Avoid bad entries
Ensure larger profits
Minimize losses
Successful traders do not trade everything — they wait for patterns, plan their trades, and stick to the strategy.