$XRP 1-hour chart for XRP/USDT Perpetual here’s a quick technical analysis and what the next move might be:
🔻 Downtrend in Play
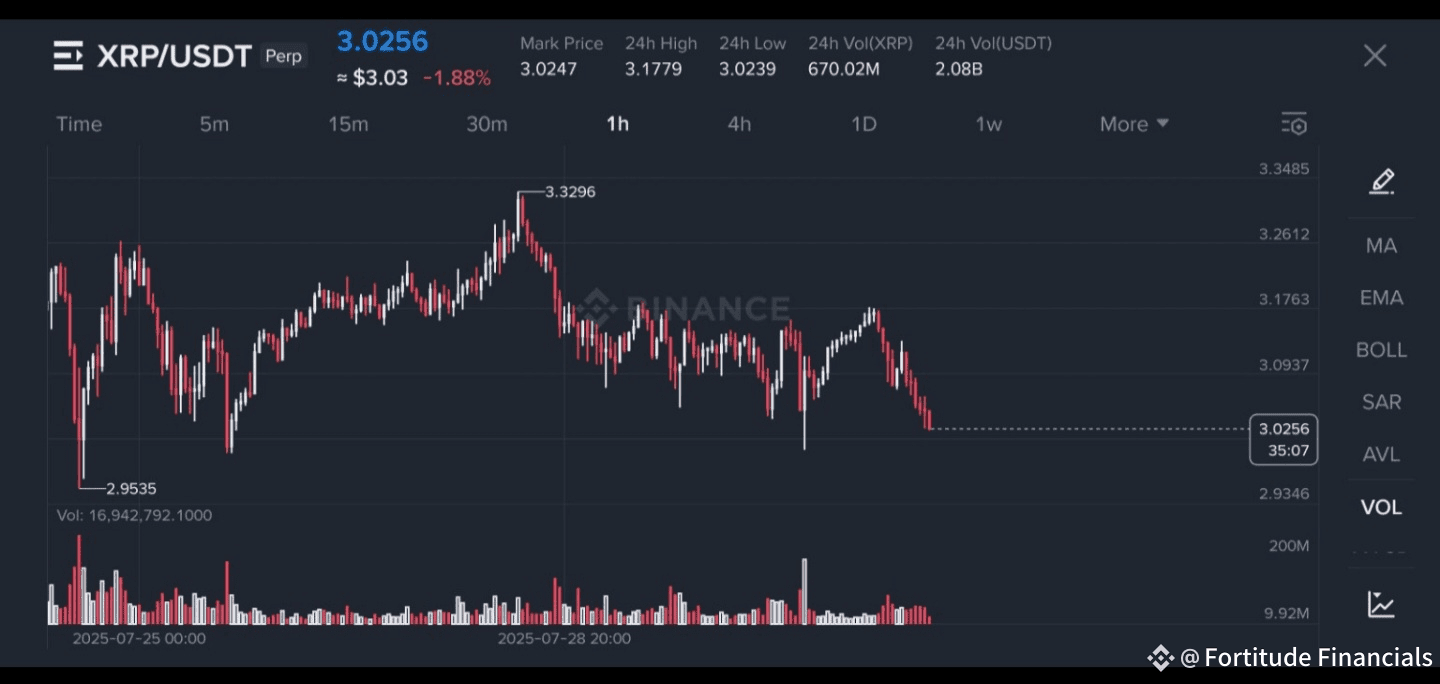
XRP recently peaked around $3.3296, and is now trading at $3.0256, showing a consistent lower high, lower low pattern.
Price has dropped nearly 10% from recent highs.
📉 Support & Resistance Levels
Support: Around $2.9535 (previous low), which could be tested again.
Resistance: Around $3.0937 and $3.1763 — both failed breakout levels in recent candles.
📉 Volume
Volume has spiked on red candles, suggesting strong selling pressure.
Recent volume bars show increased activity during the sell-off, indicating bears are still in control
🧭 What's Next?
📉 Bearish Bias (More Likely for Now)
If XRP breaks below $2.9535 (previous low), we could see a deeper correction toward $2.90–$2.85 range.
The downward momentum and high selling volume support this bearish view.
📈 Bullish Reversal Scenario (Less Likely Short-Term)
If XRP holds support above $2.95 and forms a double bottom, a bounce toward $3.09–$3.17 is possible.
For any strong bullish move, price must break and hold above $3.17 with strong volume.
📌 Short-Term Outlook
BiasTargetConfirmation🔻 Bearish (preferred)$2.95 → $2.90
Break below $2.9535 with volume
🔺 Bullish (alt)$3.09 → $3.17
Break & close above $3.0937
⚠️ Tips:
Use tight stop-losses in this volatility.
Watch for volume confirmation on breakouts/breakdowns.
Avoid FOMO entries — wait for confirmation.