
A closely watched chart analyst on X, Cantonese Cat (@cantonmeow), stated that he had increased his Dogecoin holdings after a significant Ichimoku signal appeared on the weekly chart. Posting at 2:46 PM on July 30, 2025, he shared a snapshot on TradingView and wrote: 'DOGE weekly — Ichimoku cloud — Tenkan-Kijun crossover bullish — Finding support at Tenkan (the blue line).' He continued to reveal candidly: 'I bought a little more $DOGE here.'
This Dogecoin Ichimoku Signal Cannot Be Overlooked
The chart he published was taken at 12:46 UTC on July 30 and shows Dogecoin (weekly time frame) trading near $0.216 after dropping 10.23% in the week to date. The TradingView weekly O/H/L/C index is 0.24076 / 0.24854 / 0.21440 / 0.21613, along with Ichimoku values of Tenkan-sen 0.21517, Kijun-sen 0.21142, Senkou Span A 0.21329, and Senkou Span B 0.28247.
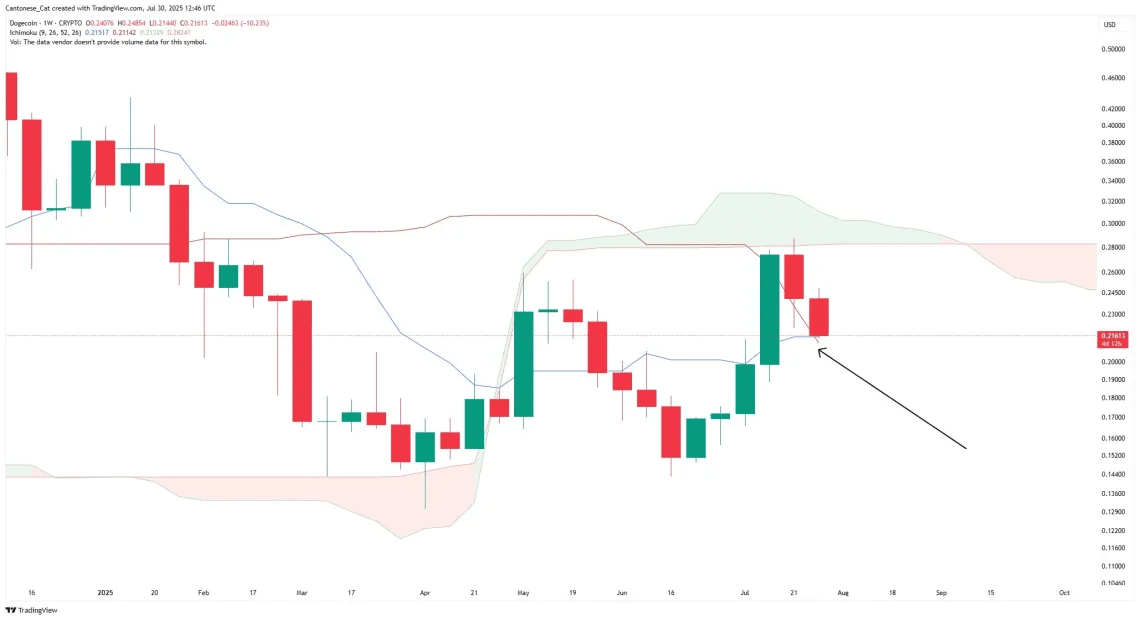
The key point in the analyst's assessment is based on the classic Ichimoku mechanism. The Tenkan-sen line (conversion line) crossed above the Kijun-sen line (base line) on the weekly chart—a event described by analysts as a bullish Tenkan-Kijun crossover. In the posted image, the spot price is slightly above the Tenkan and Kijun lines, consistent with his remarks that the price is 'finding support at the Tenkan line.'
In the Ichimoku method, Tenkan often serves as a measure of fast momentum fluctuations and when it crosses above the slower Kijun, it can signal the beginning of a trend led by momentum. On higher time frames like weekly, participants often regard those turning points as more significant compared to daily charts.
However, similar screenshots show that DOGE is trading below the previously forecasted weekly cloud (Kumo), with Senkou Span B rising close to the $0.28 region. In technical terms, signals appearing below the cloud are often classified as weaker than those appearing above the cloud, even when the Tenkan-Kijun crossover is bullish. The image also illustrates the context of this movement: after a strong green candle in mid-July, two subsequent red weekly candles appeared, causing the price to concentrate around the Tenkan/Kijun area.
When asked to check the status the next day, the analyst reiterated that the technical picture remained intact: 'DOGE is holding the weekly Ichimoku Tenkan and Kijun support so far,' he wrote on July 31. That comment emphasizes how Ichimoku practitioners often assess trend health by observing whether the price can close above Kijun in the selected time frame and continue to respect Tenkan as the price retraces.
Currently, the story is quite simple: a bullish Tenkan-Kijun crossover on the weekly chart, with the price attempting to cling to these lines while the cloud above looms as a long-term resistance. As is customary with Ichimoku analysis, next week's closing level relative to Tenkan and Kijun will be a key reference for traders to monitor whether this initial signal can develop into a broader uptrend.