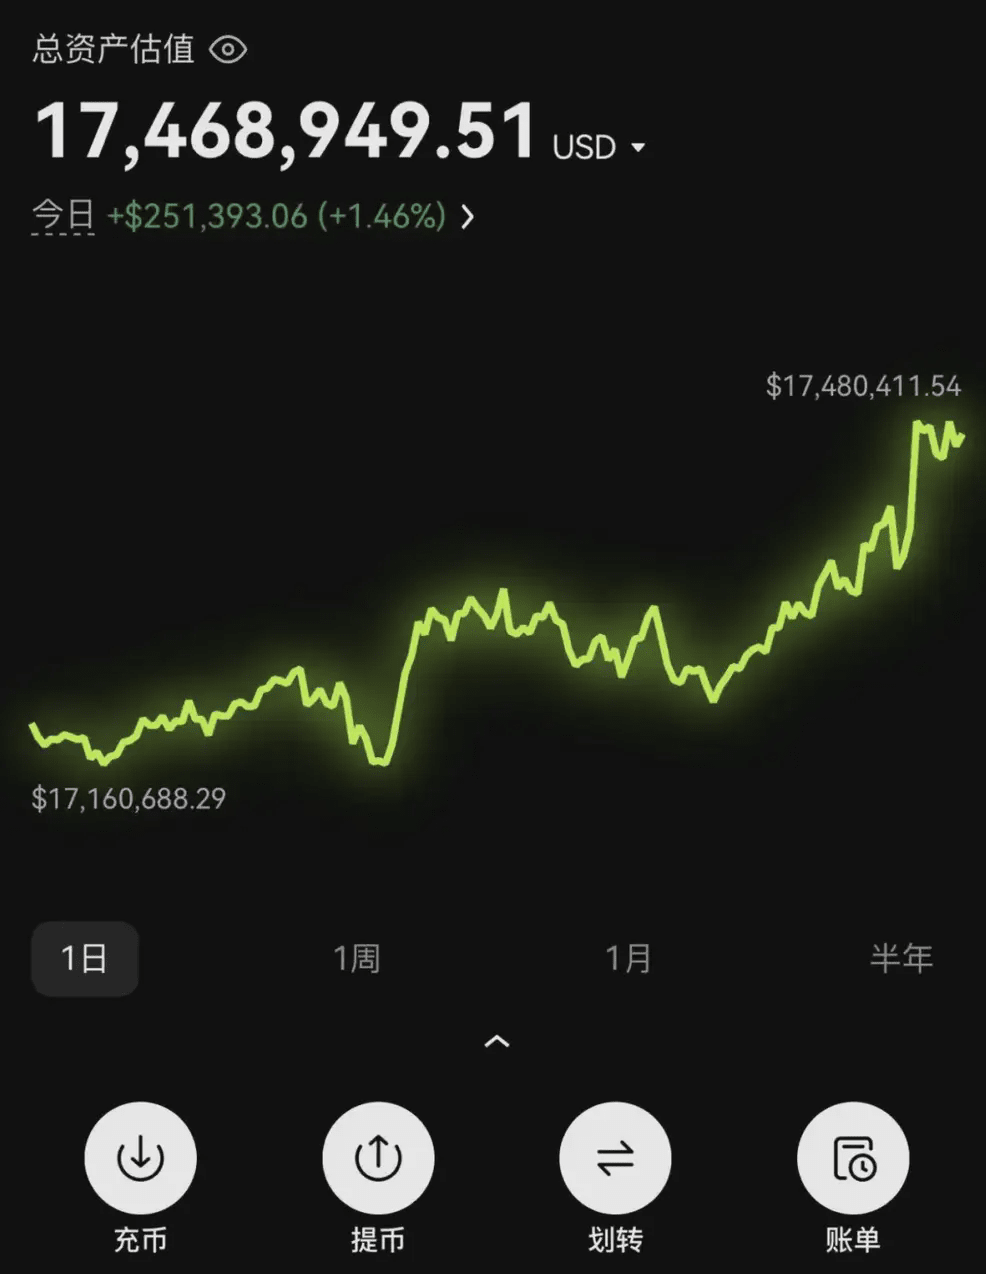
I have approximately earned around 4 million, with an initial capital of 50,000. I have never worked after graduating from college.
I have always played in Fujian and Hainan, not buying a house or a car. Monthly expenses are 1500.
Why enter the circle:
If you want to change your fate, you must try the cryptocurrency circle. If you cannot get rich in this circle, ordinary people will have no chance in their lifetime.
Execute trading this way! Earning one million is achievable.
1. Work hard for two months to increase your capital to around 10,000.
2. Buy tokens when Bitcoin is above ma20 on the weekly chart, buy two or three, ensuring they are new tokens, hot tokens during bear markets, such as apt before it surged. As long as Bitcoin rises slightly, it will take off, like op. Just remember to have heat and a story to tell.
3. If Bitcoin drops below ma20, stop-loss, buy or continue to earn during the waiting period, giving yourself two to three chances to fail. If you have 20,000 in savings, invest 10,000, allowing for three failures.
4. If you buy the token apt, aim for about 4-5 times profit. Continuously execute the strategy; remember you are trading with small capital, so you must buy new tokens and not ETH or BTC. Their price increases cannot support your dreams.
5. If you take three 5x profits from the start of a bear market to a bull market, that's about 125 times. This period could be as short as one year or as long as three years. You have three chances to fail; if you fail all three times, it means you do not have the capability, stay away from this circle, and avoid investments, especially contracts. In short, remember to enter the market when it’s time, and stop-loss when it’s time, and be patient.
6. Trading has both losses and gains; this is normal. Don't be affected by temporary profits or losses. Calm your mind to gain insight!
It took nearly 10 years for my personal account to grow from 300,000 to 1,000,000, but once I hit 1,000,000, it felt like a breakthrough, and it directly jumped to 40,000,000. I summarized 12 iron rules; it's brief but very real. If you want to play in the token market for the long term, this article is worth your serious reading, and you will also have an epiphany after reading it!
1. When trading tokens, focus on strong coins and only look at coins in an upward trend. Do not consider coins in a downward trend, as we do not have time to accompany the main force. If it remains above the trend line, then hold patiently. For example, early this year with AI tokens, as long as it does not break below the 30-day moving average*, hold until it breaks down to exit.
2. Look at the main trend method + when the market trend is good, there will definitely be a main trend direction. If this main trend is weak or simply does not exist, it indicates that the recent market risk exceeds opportunity, and one should patiently wait for the main trend to appear, avoiding blind operations.
3. Don't put all your eggs in one basket; the same goes for trading tokens. Do not invest all your capital in one token, even if you are very optimistic. Learn to diversify, and do not hold more than four tokens at a time.
4. Don't always think about buying and selling tokens; feeling uneasy if you don't operate for a day can lead to frequent trades that provide momentary pleasure but can cause significant losses. The only ones profiting are the brokers. You do not have the level for short, fast trades, and you are not the market maker*.
5. After significant losses, take a break; after significant gains, take a break even more. From a psychological perspective, a significant loss can affect your mindset, making it difficult to remain objective. At this time, one must understand their revenge trading psychology, seeking to recover or make back what was lost in one go is a gambler's mentality, which is undesirable. After a significant gain, the emotions peak, making it easy to lose the cautious mindset, leading to significant losses after large profits.
6. Diversify your positions; do not invest heavily in one token at once, even if you are optimistic. Subsequent proof of your correctness does not justify this approach, as no one knows what will happen tomorrow!
7. Many retail investors stare at minute charts all day. In fact, this approach not only has no benefits but also disrupts your trading mindset. Trading tokens also requires a balance between work and rest; spending just an hour a day reviewing is sufficient.
8. Think and summarize every trade, bravely confront your account and delivery orders; probabilities will tell you what to do next.
If you cannot overcome psychological barriers, no amount of failures can be transformed into experience.
Once again, I will share a set of practical strategies I have developed over the years. My method for trading tokens is very simple and practical; I turned my investments into eight figures within a year by seizing opportunities, only trading when there are clear patterns, maintaining a win rate of over 90% for five years!
I have summarized the essence of 'RSI Band Trading'. '14 charts teach you the ultimate principles of RSI band trading.' As long as you master this method, you can ensure that your account increases 30 times by trading tokens. Today, I have carefully organized this valuable information to share with those who are destined to find it; make sure to keep it well.
Undoubtedly, the Relative Strength Index (RSI) may be one of the most commonly used technical indicators among global traders. It is a momentum oscillator developed by renowned Wall Street trader J. Welles Wilder, designed to capture the speed and changes in price movements.
To this end, it is represented by values ranging from 0 to 100, with values below 30 considered 'oversold' and above 70 considered 'overbought.' This way, the indicator can draw attention to potential turning points in the current trend that may lead to corrections in the existing long-term trend or even trigger genuine trend changes.
RSI Calculation Formula
RSI is usually calculated using the following formula:
RSI = 100 - [100 / (1 + RS)]
Where RS (Relative Strength) is the average closing price of gains over x days divided by the average closing price of losses over x days. The most common period is 14 days, but traders can adjust this value according to their preferences and trading styles.
RSI levels
Between 0 and 30: Extremely oversold
Values below 30 indicate that the market is in a severe oversold state. Traders will focus on potential changes in price trends, indicating that the existing downward trend may shift into a new upward trend.
However, this is not absolute. Always remember that a downward trend with strong momentum may cause the indicator to remain in the extremely oversold area for a long time. Therefore, blindly buying simply because the value is below 30 is not a good strategy.
Between 30 and 50: Slightly oversold to neutral
Values above but close to 30 indicate that the market is in a slightly oversold state. If the value is closer to 50, it is more likely to be in a neutral state.
Between 50 and 70: Neutral to slightly overbought
Values above but close to 50 are also considered neutral. However, if the value approaches the 70 level, it indicates that the market is in a slightly overbought state.
Between 70 and 100: Extremely overbought
This area is considered an extremely overbought zone, and the market believes that the upward trend may lose momentum and may experience a genuine trend reversal, turning into a downward trend.
Nevertheless, the same observations apply to oversold conditions. A strong upward movement may attract more buyers into the market, causing the Relative Strength Index to surge rapidly. This does not mean that the market cannot continue to rise powerfully indefinitely.
Once again, it is important not to automatically close long positions (or open short positions) simply because the indicator is in the extremely overbought state.
“Please keep in mind that these ranges are only indicative and should never be used as pure trading signals. If there are no additional elements to confirm overbought or oversold conditions, the probability of false signals will be very high.”
What settings are used?
The optimal parameter selection for this indicator completely depends on personal preference, mainly depending on the strategy you are using and the time frame it is executed in.
The default setting is a 14-period with an upper limit of 80 and a lower limit of 30. Typical band traders sometimes use a 20-period, as this roughly corresponds to a one-month trading cycle on the daily chart.
Another option is to set the upper and lower limits to 80 and 20, slightly tightening the range. This will reduce the number of signals but make the signals more reliable and decrease the occurrence of false signals.
Overbought and oversold levels
The horizontal axis represents time, and the vertical axis ranges from 0 to 100 (which is why this indicator is called an oscillator).
◎ Above 50: Technical trend is positive.
◎ Below 50: Technical trend is negative.
It measures the speed and direction of price changes.
The general rule is:
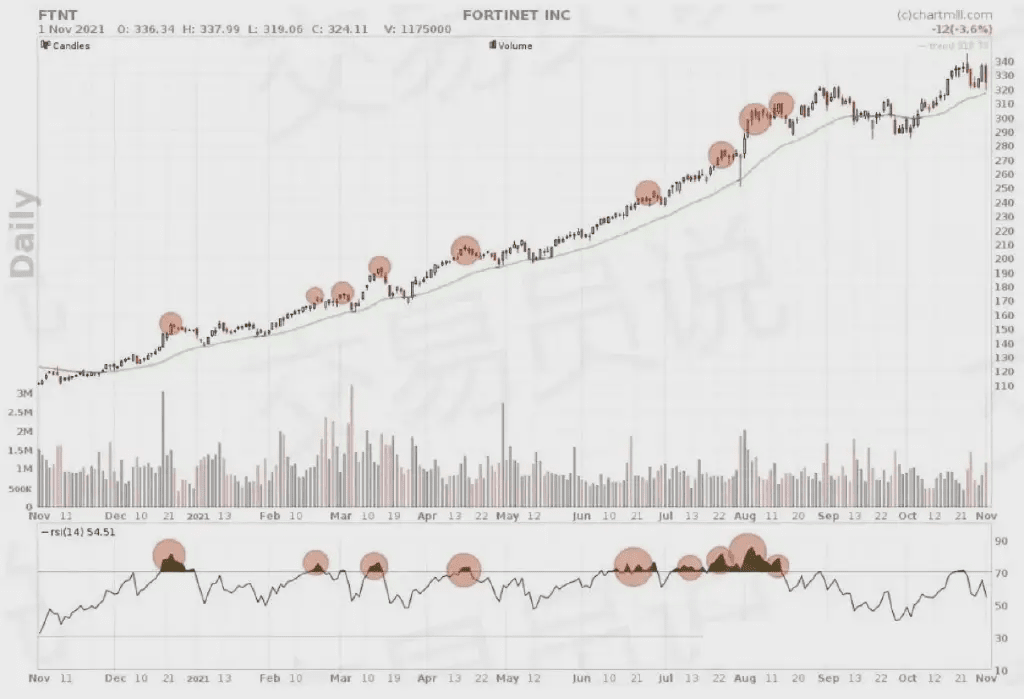
◎ When the value is above 70, it is called an 'overbought' signal, indicating that the price has risen significantly in a relatively short time, increasing the likelihood of a (temporary) decline.
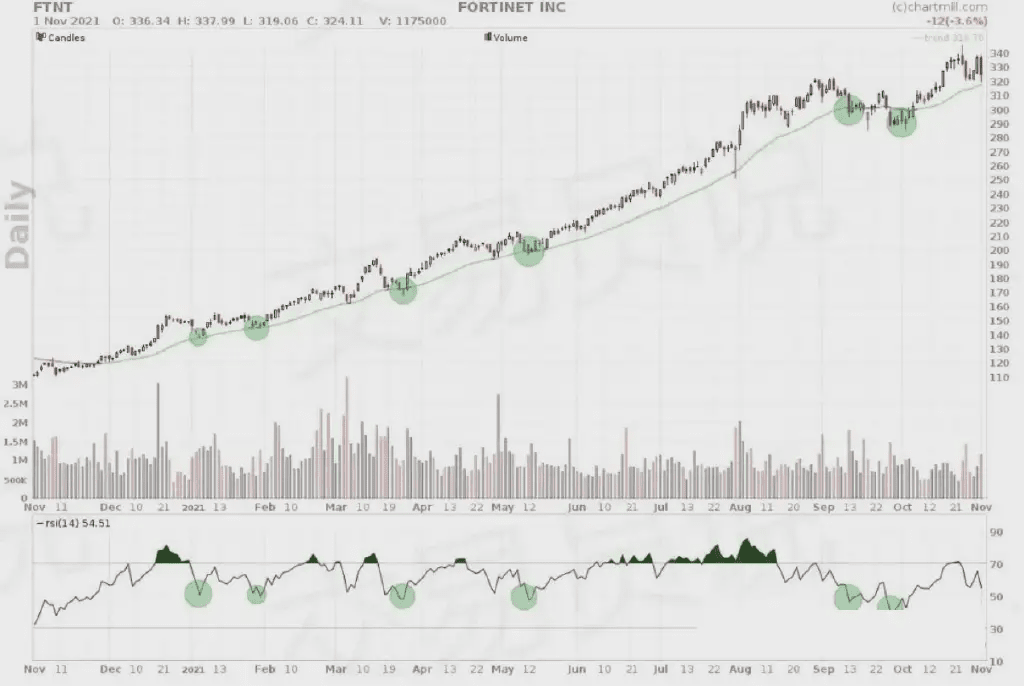
◎ When the value drops below 30, it is called an 'oversold' signal, indicating that prices have fallen significantly, increasing the likelihood of a (temporary) rebound.
Visually, the indicator looks like this: you can identify peaks above 70 and troughs below 30:
The RSI shown here is illustrated with the price chart of energy company Cenovus Energy:
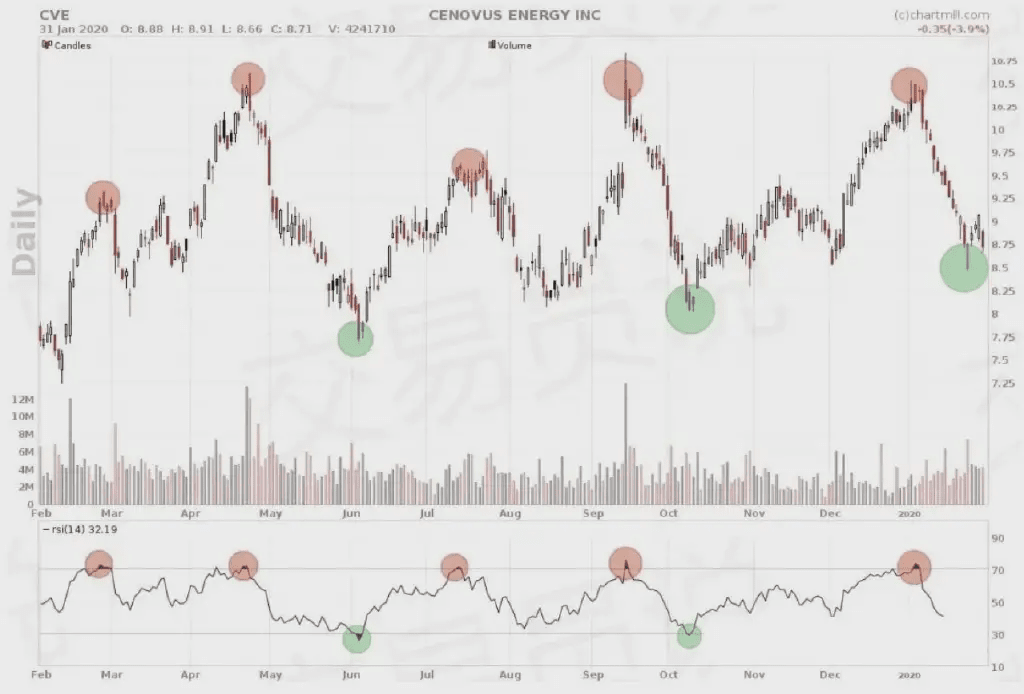
The red circles in the chart indicate sell signals, while the green circles indicate potential buy signals. Any trader who buys at the green circle and sells at the red circle has made considerable profits!
This chart shows that RSI levels provide good signals primarily in sideways consolidating markets.
Three different ways to use these levels in trading strategies
We emphasize that the reliability of the RSI indicator highly depends on the market phase of the stock or market.
We distinguish the following phases:
◎ Price is within a sideways channel (consolidation area).
◎ The price shows a clear upward trend.
◎ The price shows a clear downward trend.
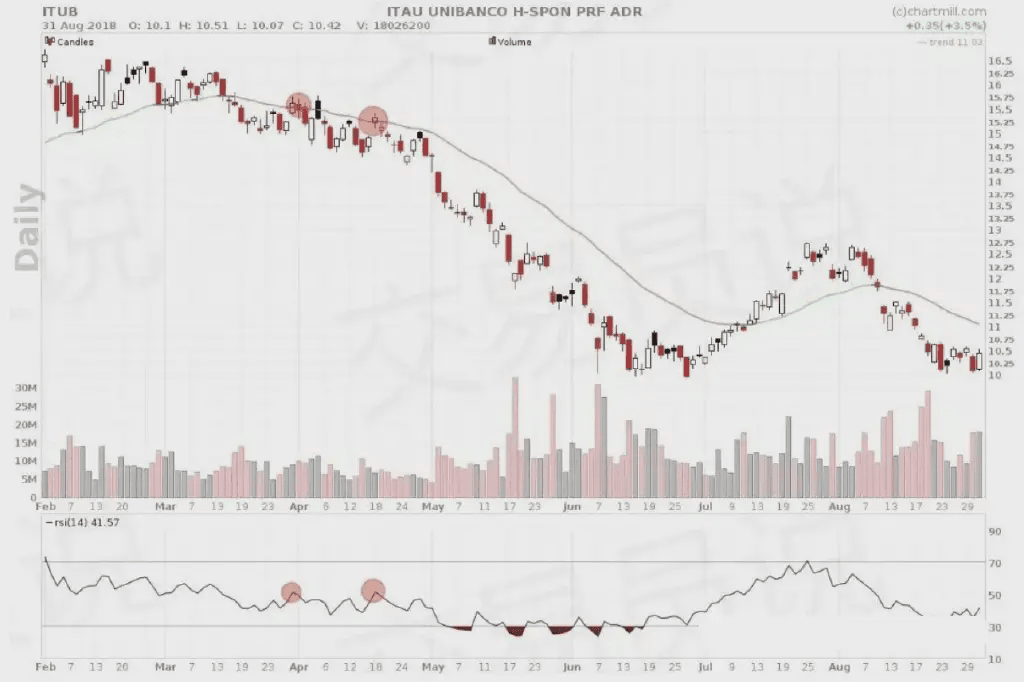
1. Sideways price channel
In a sideways price channel, we have seen classic buy and sell signals (buy at <30, sell at >70) are relatively reliable.
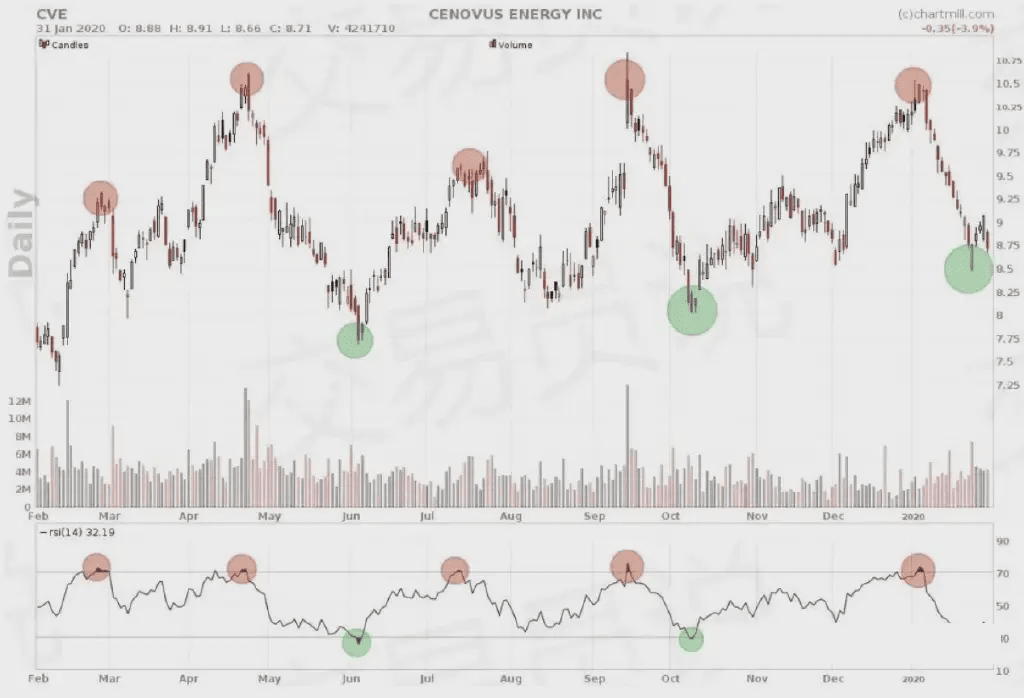
The stock price fluctuates within a wide sideways channel between approximately $10.75 and $7.50. Each time it reaches one of the two boundaries, the price will either drop or rise. In this case, RSI shows accurate signals.
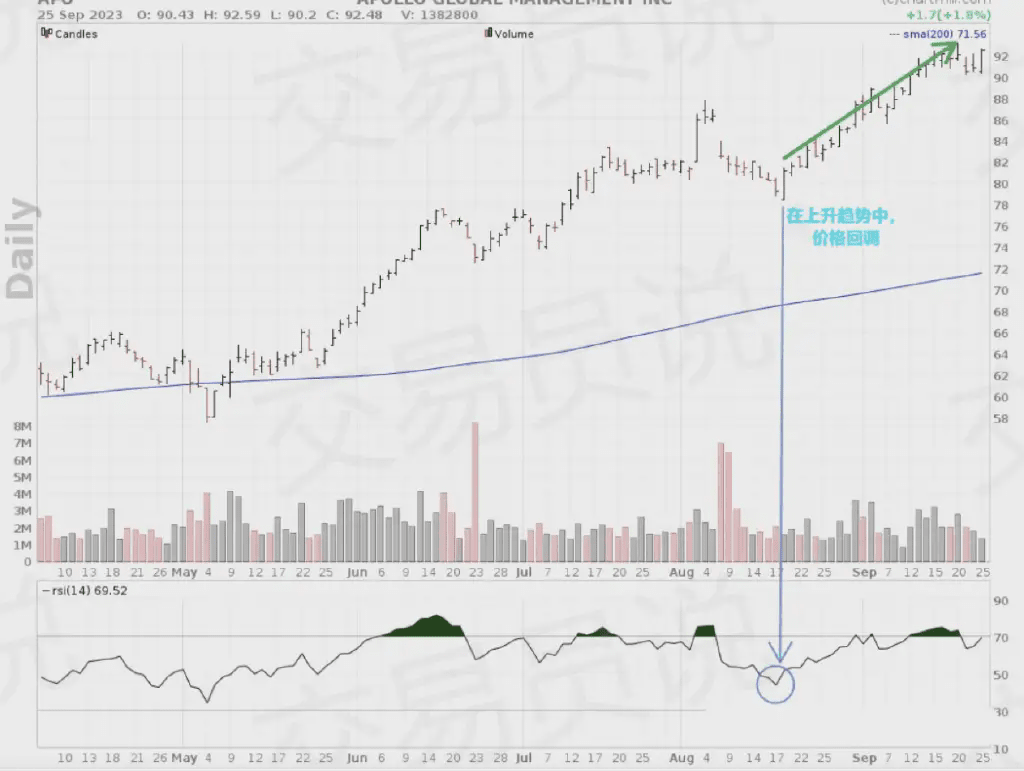
2. Upward Trend
In prices with a clear upward trend, classic usage is significantly less effective. The strong upward trend in the following chart is evident.
As long as the trend continues to rise, it is advisable to ignore sell signals. In this case, you can try to buy when there is a temporary drop in an upward trend.
Of course, you can also use the RSI indicator to achieve this. In the following chart, we show the same chart but ignore the sell signals and mark the moments when the RSI value drops below the 50 level.
In an upward trend, buying when RSI drops below 50 usually yields very good results and allows you to increase your position in the same stock (or other varieties).
3. Downward Trend
Similar to an upward trend, in a sharp downward trend, if prices temporarily rebound, RSI can also be used to short. In the following chart, we marked the points where the trend indicator shows a downward trend (red line) and the occasional price rebounds, at which point the trend indicator becomes neutral (gray) but never turns positive (green).
At these moments, when the RSI value exceeds 50, the indicator shows a sell signal.
“In stocks that show a strong price trend (upwards or downwards), the classic lower and upper limits (30 and 70) are too extreme in many cases. In such cases, the 50 level is better suited for identifying overbought or oversold periods.”
Power of Divergence: Early detection of new price trends
Divergence means there is a discrepancy between the price evolution on the chart and the indicator trend.
As this divergence often occurs just before the end of an existing long-term trend, active investors use it to identify early changes in long-term price trends, thus opening new positions in the direction of the reversal trend.
Divergence is divided into bullish (positive) divergence and bearish (negative) divergence.
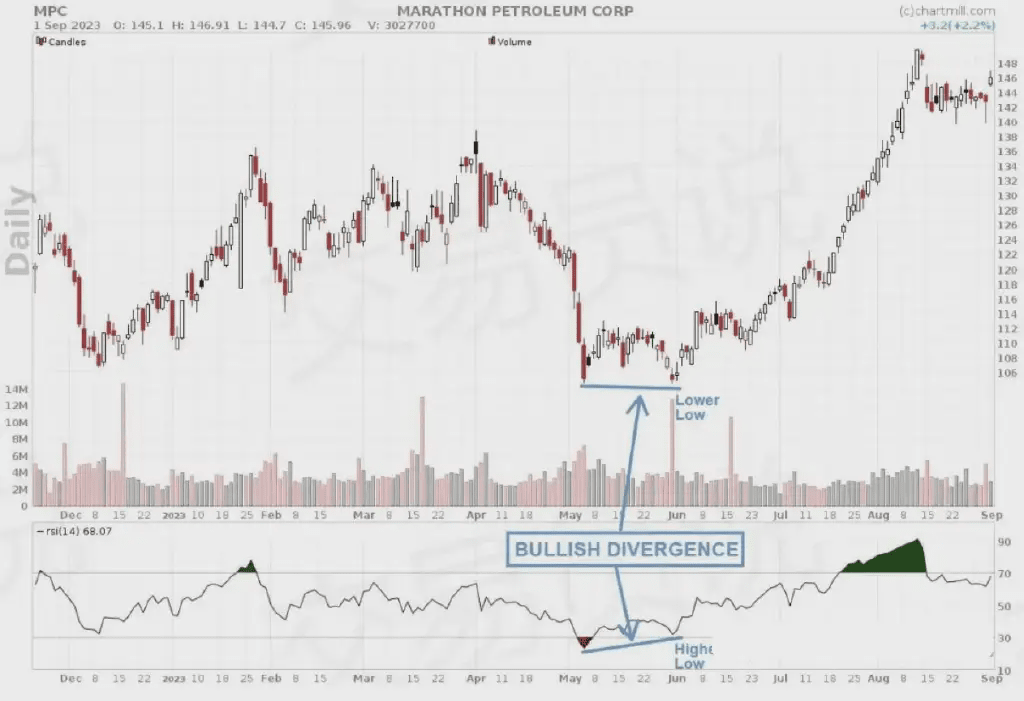
Bullish RSI Divergence
Bullish divergence occurs when the price chart still shows lower lows while the RSI chart line indicates an opposite trend. This is a signal indicating that the intensity and momentum of the downward price trend are weakening (at least temporarily), thus increasing the likelihood of a temporary price rebound.
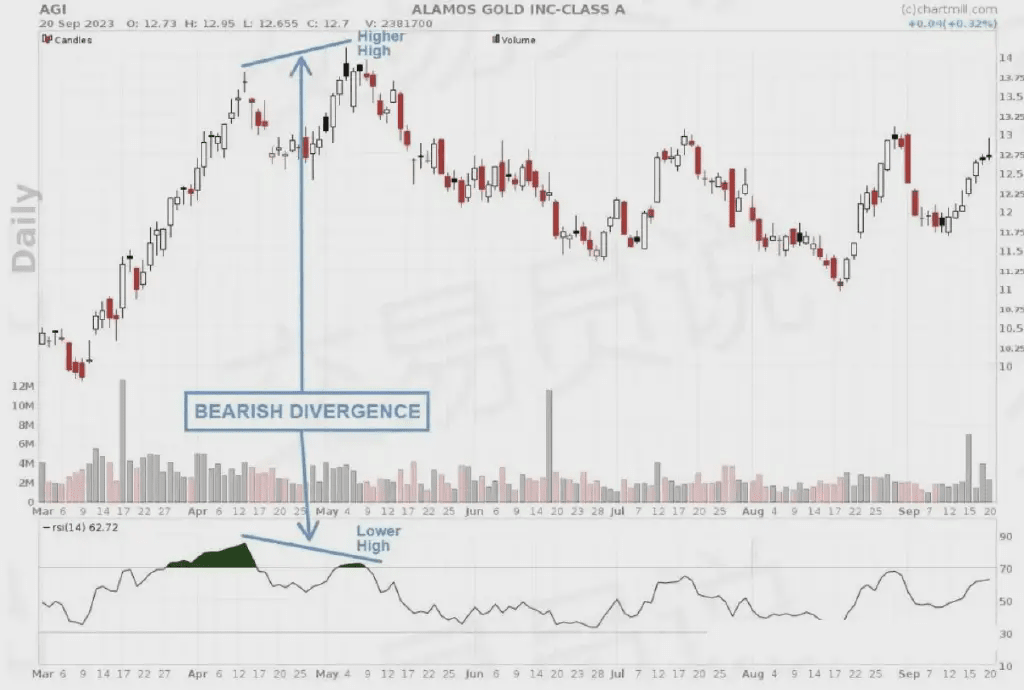
Bearish RSI Divergence
When the indicator shows a lower peak while the price continues to rise, bearish divergence occurs. This indicates that the strength and momentum of the upward trend are weakening (at least temporarily), and there is a possibility of a (medium-term) price decline.
Hidden Divergence: Utilizing temporary price changes in existing trends
This form of divergence is a derivative of classic divergence and mainly occurs in stocks that show a clear upward or downward trend.
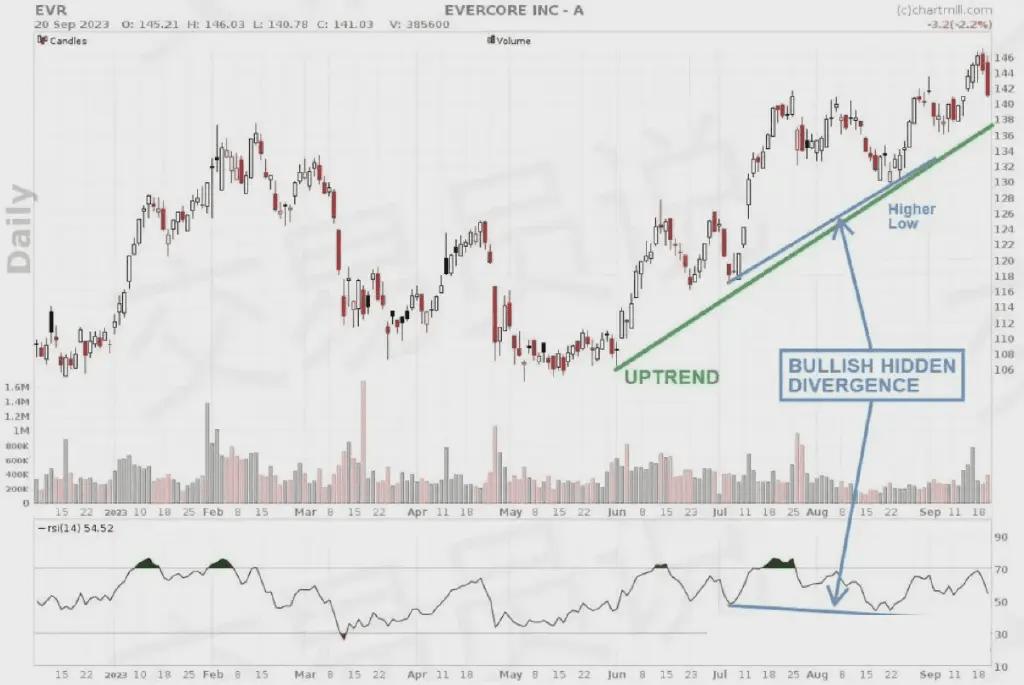
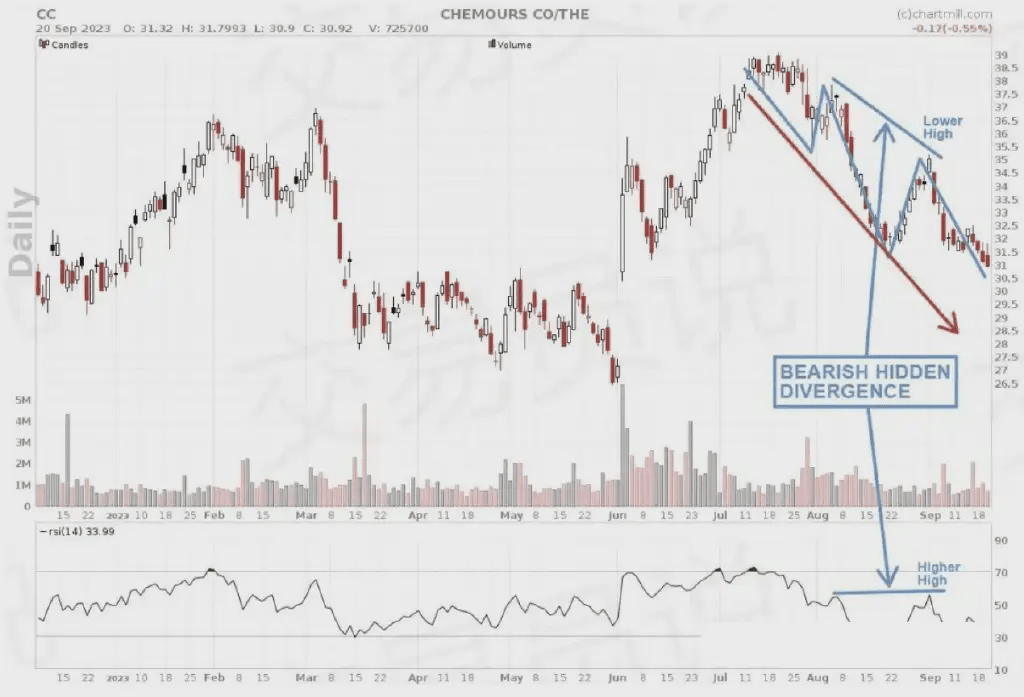
Hidden divergence appears when prices temporarily drop in an upward trend or temporarily rebound in a downward trend.
Example 1: Hidden Divergence in an Upward Trend
The following chart shows Evercore stock, which has been in an upward trend since early June 2023. The recent price drop has created a new higher low, but in terms of RSI, it has formed a lower low, thus generating bullish hidden divergence.
Example 2: Hidden Divergence in a Downward Trend
Similar hidden divergence also appears in downward trends. Chemours stock peaked between July and August 2023, then the price dropped and formed several consecutive lows. However, the recent lower highs in the price formed higher lows in the indicator, identified as bearish hidden divergence.
How to use the RSI indicator for band trading
As we mentioned at the beginning, the Relative Strength Index (RSI) is one of the many technical indicators that technical analysts use to profit from short to medium-term price fluctuations in the market.
After understanding the basics of RSI, we will next detail the different steps to successfully use the RSI indicator in band trading strategies.
1. Choose the appropriate time frame.
Typical band trading strategies hold positions for days to weeks, so positions can also be held overnight.
The default setting for band trading is a 14-period on the daily chart, corresponding to a 14-day time frame.
Shorter time frames generate more signals, but the margin of error will also increase. Using longer periods may cause you to miss part of the price fluctuations.
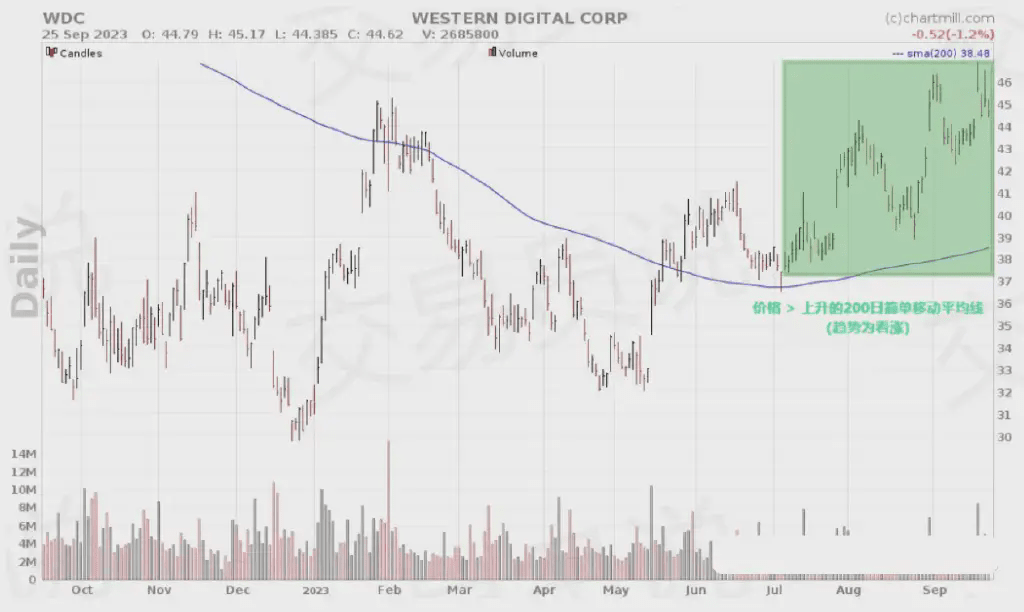
2. Determine the current trend
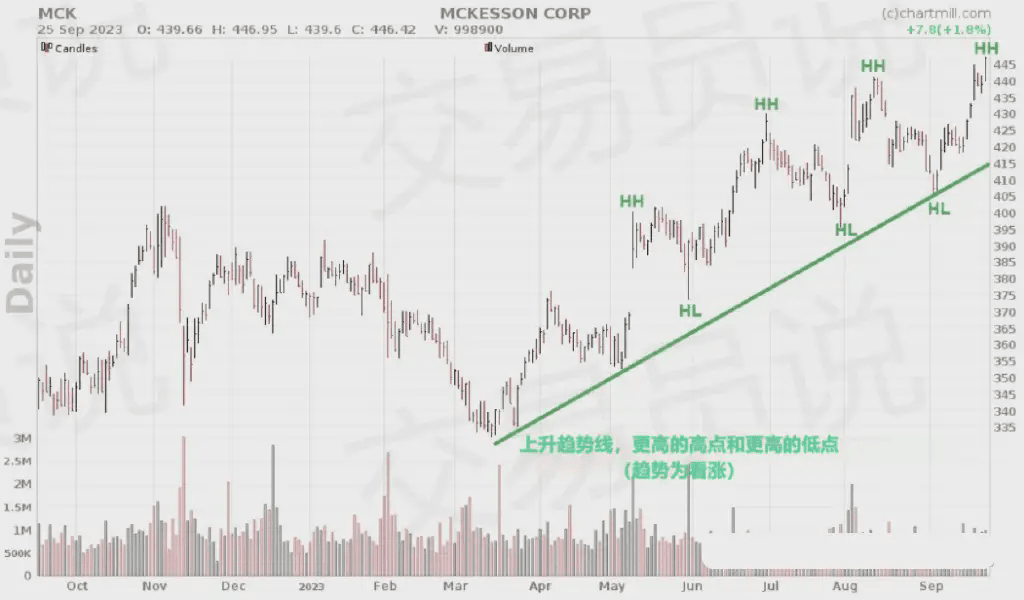
Trading in the direction of the main trend has the highest probability of success. For instance, you can use the 200-day moving average to determine the long-term trend. For long positions, only choose stocks that have an upward long-term moving average and are priced above the average.
Another purely visual method to determine the current trend is to use an upward trend line (requiring at least three connection points).
3. Determine (and optimize) RSI signals.
As we mentioned above, typically, the RSI values of 70 and 30 are used to identify overbought and oversold assets, and these levels may indicate potential trend changes.
However, do not be overly fixated on these levels; many factors depend on the momentum and strength of the existing trend. For example, in a strong upward market, a temporary price reversal does not always lead to RSI dropping below the 30 level.
Similarly, in a strong downward market, a temporary price rebound does not necessarily mean that the RSI will rise above the 70 level.
In the above situations, when the RSI value rebounds from the 50 level, it may have triggered an effective buy or sell signal.
4. Do not rely solely on indicators
Technical analysis and its indicators do not guarantee trading success. Trading based solely on this indicator or any other indicator is the quickest way to incur losses!
As mentioned above, trades should only be made in the direction of the long-term trend. After all, this will help you avoid many false signals.
In addition, always pay attention to price behavior. Chart patterns, candlestick formations, and support and resistance levels that appear simultaneously with indicator signals are important confirmation signals that can significantly improve the reliability of trading setups. Remember, the quantity of signals is not important; quality is key.
5. RSI Divergence
As mentioned above, we have learned about the types of divergence and their meanings. When looking for entry points in a strong trend, hidden divergence is particularly important.
Hidden divergence is a derivative form of classic divergence, mainly occurring in stocks that display a clear upward or downward trend.
Hidden divergence appears when prices temporarily pull back in an upward trend, or temporarily rebound in a downward trend.
6. Accurately determine entry and stop-loss points.
Develop a trading plan and execute trades according to the plan!
Determine entry and stop-loss points in advance based on your strategy. This ensures you can accurately identify and limit risks. After all, protecting account capital is the top priority for every trader.
Exit points can be a predetermined fixed price level, but another option is to use a trailing stop loss to profit from the trend for as long as possible while protecting a larger portion of accumulated profits when prices move further in a favorable direction.
7. Position size and risk management
Equally important as the trading setup itself is how you determine position size and its associated risks (related to the set stop-loss).
Only those traders who can effectively manage losing positions and ensure that losses remain minimal can achieve long-term success. Consistently losing 1% of overall capital over five trades is not disastrous. However, several individual open positions leading to losses of several dozen percentage points in a portfolio would be catastrophic!
Frequently Asked Questions
1. What is the difference between RSI and Relative Strength?
“RSI” and “Relative Strength” are sometimes confused because they both contain the term “Relative Strength.” However, they refer to completely different concepts:
● Relative Strength Index (RSI): It is a technical indicator used to measure the strength and momentum of price movements of financial instruments. It is an oscillator that ranges from 0 to 100. RSI helps traders identify overbought and oversold market conditions, potential trend reversals, and divergences between price and momentum by comparing the recent gains and losses over a certain period (usually 14 days).
● Relative Strength (Relative Strength, in the investment field): It is a tool that measures the performance of one investment or asset class relative to another. It is used in portfolio management and asset allocation, so it is not an indicator like RSI. Relative strength can be calculated by dividing the performance of one asset class (or investment) by the performance of another asset, used to determine which assets perform stronger (outperform) or weaker (underperform) relative to a benchmark or another asset.
2. What is the difference between RSI and Stochastic RSI (Stochastics-RSI)?
Stochastic RSI (Stochastic-RSI), like the ordinary stochastic indicator (Stochastic), is a momentum indicator mainly used to identify overbought or oversold levels. The addition of the term 'RSI' means that stochastic RSI is a derivative of the ordinary RSI indicator. The difference from the ordinary stochastic indicator is that stochastic RSI relies on the RSI value rather than the price of the underlying asset.
However, the formula used to calculate the value remains unchanged.
3. Is RSI a good indicator?
The Relative Strength Index is a valuable tool in technical analysis, but traders and investors should be aware of its limitations.
For example, it is usually used to identify overbought (above 70) and oversold (below 30) conditions. However, these levels do not provide certainty. In fact, the market can remain in extreme conditions for a long time, and relying solely on RSI as an entry and exit point can lead to (and often does) false signals.
The same applies to so-called divergence signals (when RSI and price move in opposite directions). This is a signal pointing to potential reversals, but it is not always reliable. This divergence may also last quite a long time, leading to missed trading opportunities or premature entries.
Moreover, its effectiveness will vary depending on the selected period (usually 14 days). Shortening the period makes the indicator more sensitive, but it may generate more false signals; extending the period reduces sensitivity but may lead to delayed signals.
This does not mean that RSI signals lack value when combined with other technical or fundamental information.
4. Can RSI be used for day trading?
Yes, it is very popular among day traders. It is a versatile technical indicator that can be applied across various time frames, including intraday charts, making it suitable for day trading strategies.
Intraday traders can adjust the period based on their trading styles and assets. Shorter periods (like 9 or 5) are more sensitive and suited for ultra-short-term trading; while longer periods (like 14 or 21) are more suited for slightly longer intraday trading.
Strong recovery, assets doubling! Follow the rain, layout in advance, easily achieve great returns.
Keep an eye on: A2Z CFX
