The daily chart of XRP/USDT provides a crucial perspective on its recent price action, particularly the aftermath of the significant rally fueled by the SEC lawsuit settlement. As of late July 2025, XRP is undergoing a period of significant retracement, testing key support levels that will likely dictate its short-to-medium term trajectory.
The Post-Pump Correction:
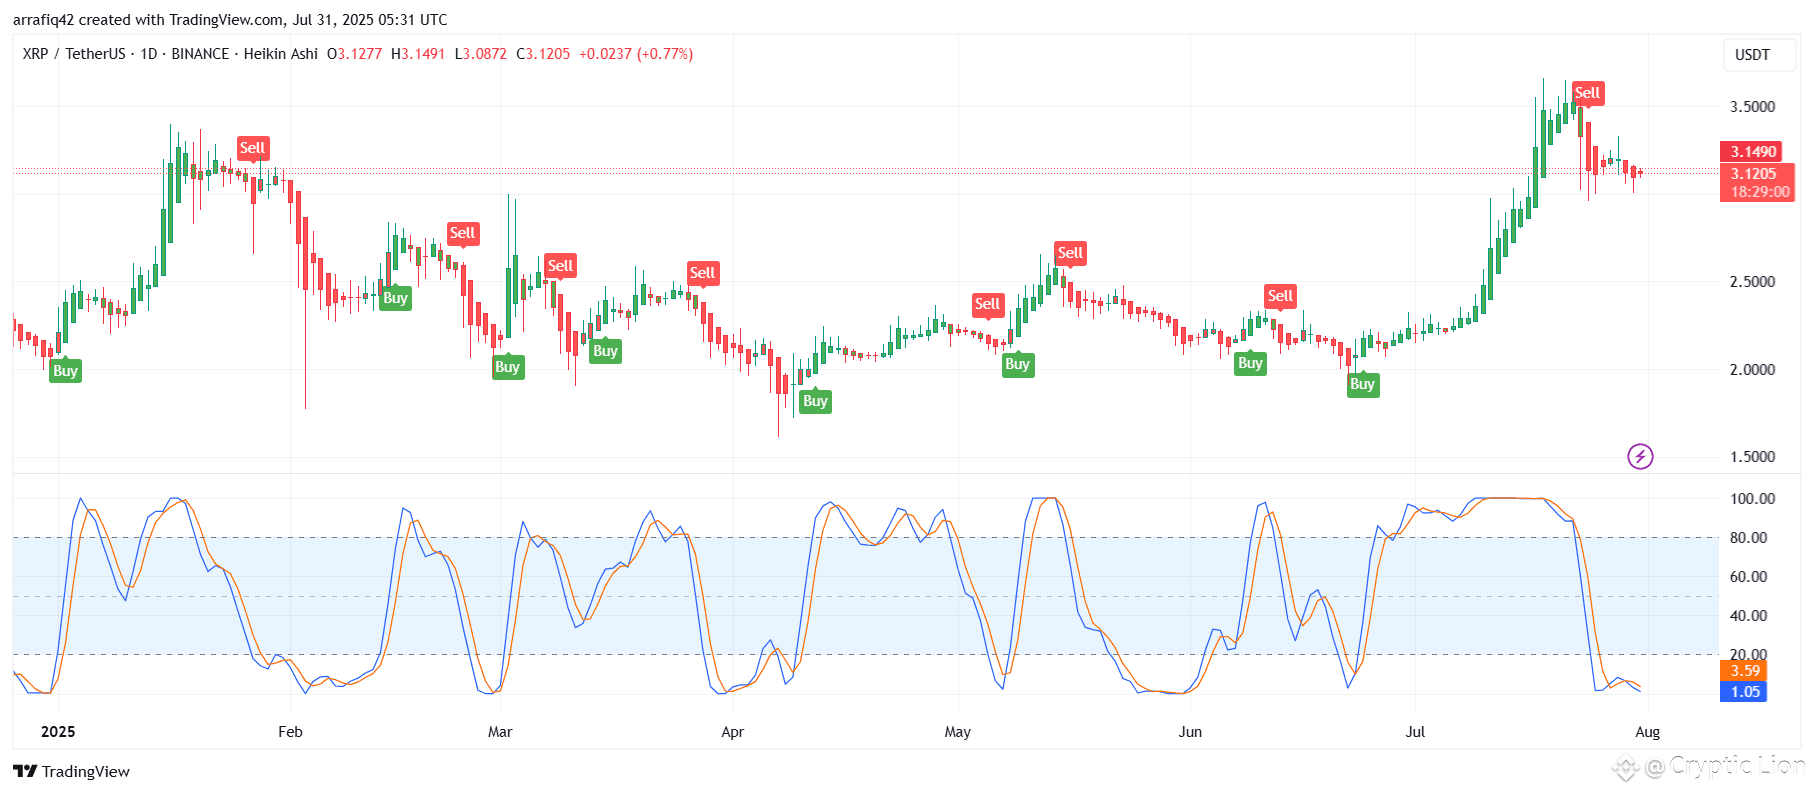
The chart clearly illustrates the explosive green candles in mid-July that propelled XRP from below $2.00 to highs above $3.60. This was a direct response to the regulatory clarity. However, this powerful surge has been followed by a notable correction, characterized by a series of red (bearish) Heikin Ashi candles. This retracement is a healthy and often necessary market behavior after such a rapid ascent, as early buyers take profits and the market consolidates its gains.
Stochastic RSI: Deeply Oversold and Signaling Potential Reversal:
The Stochastic RSI, a momentum oscillator, is now deeply in the oversold territory, with both its %K and %D lines well below 20. Specifically, the %K line is at 3.59 and the %D line is at 1.05. This is a critical observation. Historically, such deeply oversold conditions on the daily timeframe often precede a bounce or a significant reversal in price, as selling pressure becomes exhausted. The current upward curl of the %K line, even from these low levels, hints at diminishing selling momentum and a potential for buyers to step in.
Key Levels Under Scrutiny:
Resistance: The immediate overhead resistance is evident around the $3.15 - $3.25 zone, corresponding to the current struggle. Beyond that, the recent high near $3.60 and the all-time high of $3.84 remain formidable barriers that would require significant bullish momentum to overcome.
Support: The chart shows XRP testing a critical support zone. Visually, there appears to be significant support building around the $2.80 - $3.00 psychological and structural level. This area aligns with previous consolidation points before the major breakout. A sustained hold above this zone would be crucial for a recovery. A break below it, however, could see XRP test deeper support levels, possibly towards the $2.50 or even $2.20 mark, depending on market sentiment and volume.
Potential Scenarios (Not Predictions):
Given the current technical posture:
1. Bounce from Oversold: The deeply oversold Stochastic RSI strongly suggests that XRP could experience a short-term relief rally or bounce from its current support levels. This bounce might target the $3.15-$3.25 resistance first.
2. Consolidation within Range: After the sharp correction, XRP might enter a period of sideways consolidation within a defined range (e.g., $2.80 - $3.25) as it accumulates strength and the oversold conditions reset.
3. Further Retracement (Less Likely, but Possible): While less probable given the extreme oversold condition, a complete capitulation of buyer interest or broader market weakness could push XRP below immediate support, potentially seeking stronger demand at lower price points.
Conclusion:
The daily chart clearly indicates that XRP is in a necessary corrective phase after its landmark legal victory. The key battleground is the current support zone. The heavily oversold daily Stochastic RSI points towards an increased probability of a near-term bounce. However, sustained recovery will depend on XRP's ability to hold these support levels and eventually break above its overhead resistances, ultimately building a new foundation for its next potential move. Traders will be closely monitoring volume and the behavior of the Stochastic RSI for confirmation of a reversal.
$XRP #Write2Earn #XRP #Ripple #Crypto #Binance #MarketAnalysis #DailyChart #SECSettlement #Retracement #Oversold #XRPCommunity