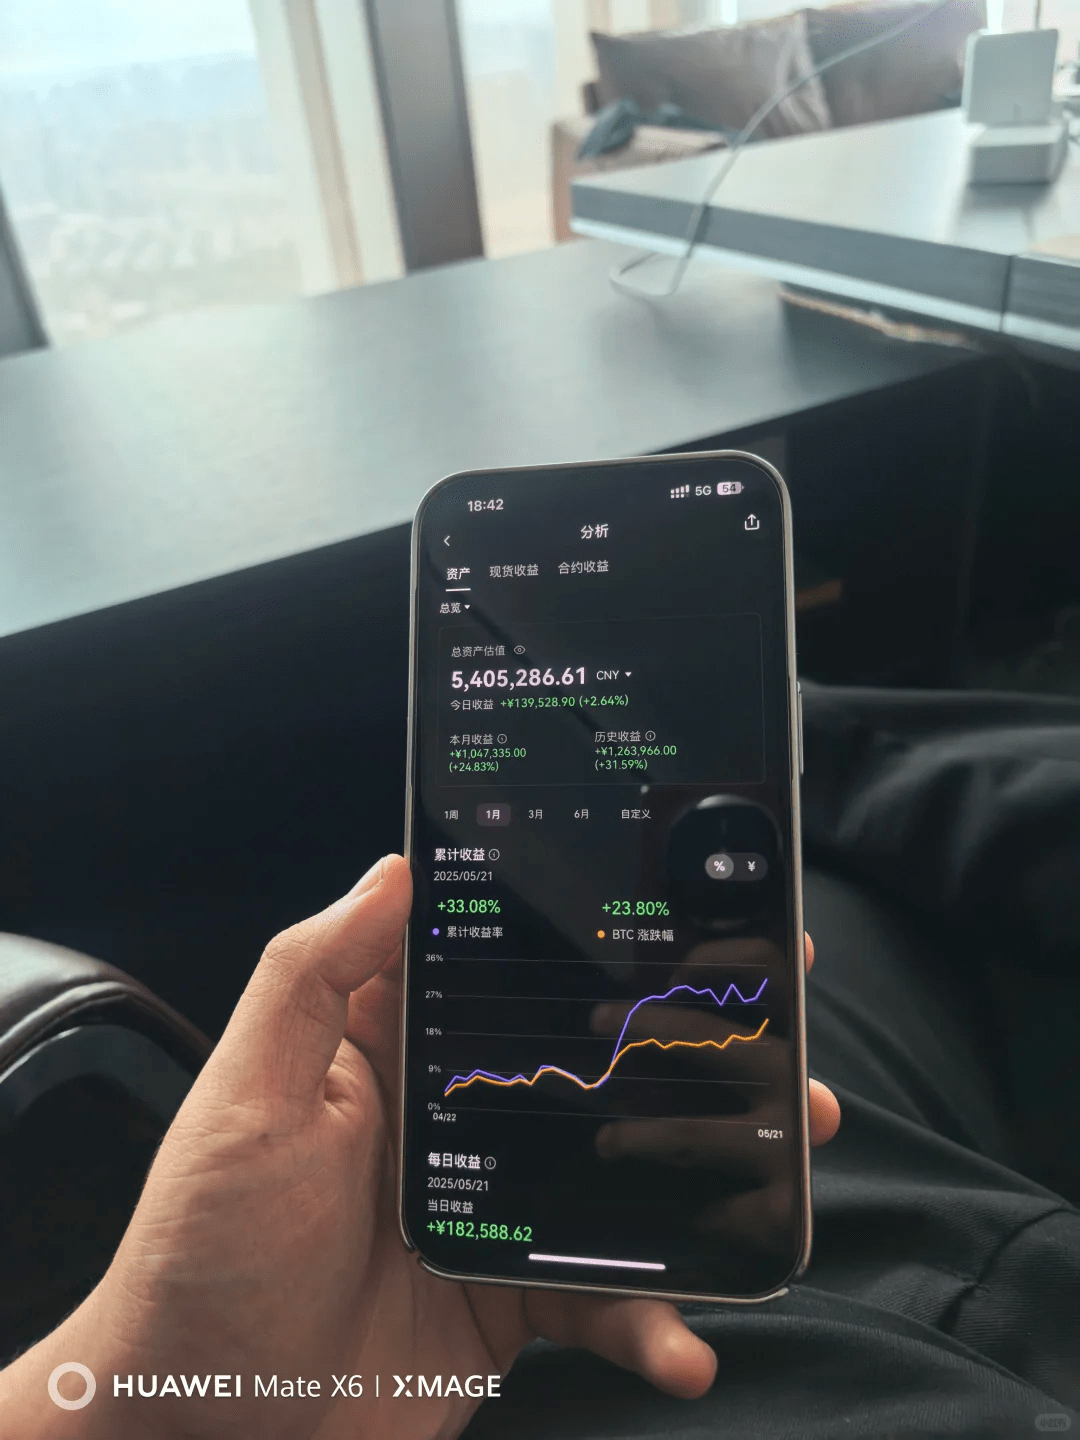
I have practiced this method in over ten thousand trades, with a win rate of up to 98%!
In May, in just one day, I made $140,000!
There are two types of engulfing patterns: bullish and bearish.
The engulfing candlestick pattern consists of two candles, thus it falls under the category of double candlestick patterns.
The structure of this pattern is very easy to identify. On the chart, the first candle is completely engulfed by the next candle. Remember, for an effective engulfing pattern to form, the body of the first candle should be completely contained within the body of the next candle. Please see the example of the engulfing pattern in the figure below:
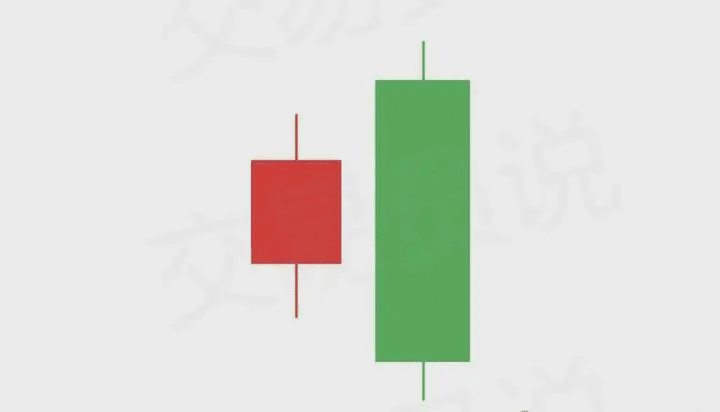
This is how the engulfing pattern appears on the chart. As mentioned above, the first bearish candle (red) is completely engulfed by the next bullish candle (green). Similarly, the reverse scenario is also possible. The engulfed candle can be bullish, while the engulfing candle can be bearish.
The potential of the engulfing candlestick pattern
The engulfing candlestick pattern has a strong reversal signal. If the price forms an engulfing pattern during an uptrend, it sends us a signal indicating that a top may be forming.
Conversely, if an engulfing pattern occurs during a downtrend, it indicates that the price movement may be forming a bottom.
Types of engulfing patterns
As mentioned earlier, there are two types of engulfing patterns: the first is the bullish engulfing pattern, and the other is the bearish engulfing pattern. Now let’s learn about these two engulfing patterns separately:
Bullish engulfing
Bullish engulfing patterns usually occur in a bearish trend. It starts with a bearish candle on the chart, which is then completely engulfed by the next bullish candle. This pattern creates bullish potential on the chart, which may reverse the current bearish trend. Please see the bullish engulfing candlestick pattern in the figure below:
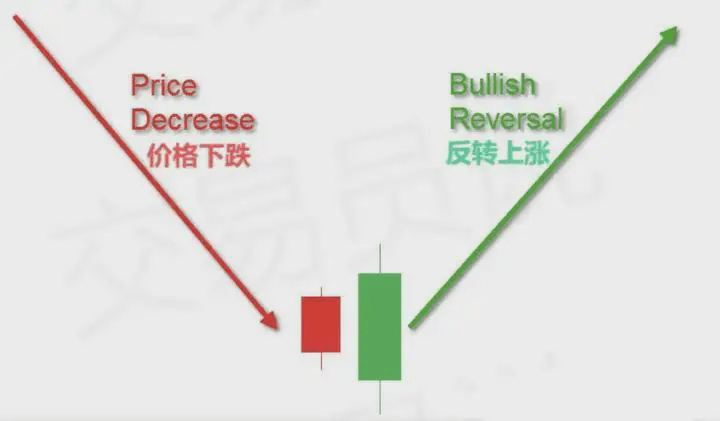
Note that the first candle in the pattern is bearish and is completely contained within the body of the next bullish candle. This forms a bullish engulfing pattern, suggesting a trend reversal. An effective bullish engulfing pattern means that after a recent decline, a bullish trend may begin.
Bearish engulfing
The function of the bearish engulfing pattern is exactly the opposite of that of the bullish engulfing pattern. The bearish engulfing pattern typically occurs in an uptrend. The pattern starts with a bullish candle, which is then completely engulfed by the body of the next bearish candle. This pattern creates strong price reversal potential on the chart, suggesting that the current bullish trend may shift to a new bearish trend. Now please look at the bearish engulfing pattern in the figure below:
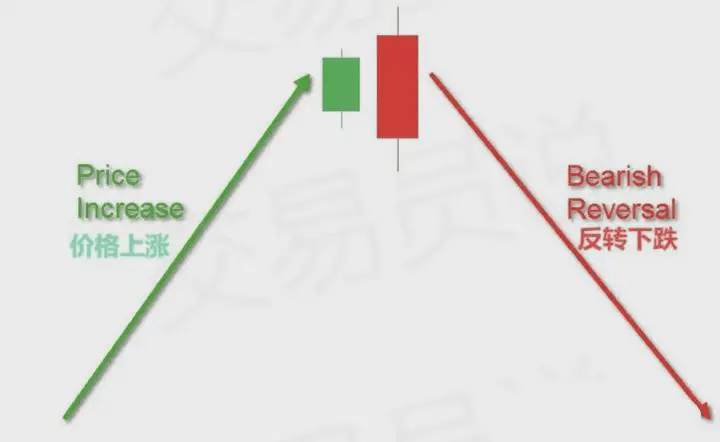
In the above chart, the engulfed candle is bullish (green), while the engulfing candle is bearish (red). The body of the second candle completely contains the first candle, completing the bearish engulfing pattern on the chart. The bearish engulfing pattern may signal the start of a new downward trend on the chart.
Engulfing pattern confirmation
The confirmation of the engulfing pattern occurs in the candle following the pattern. It needs to break the body level of the engulfing candle to confirm the validity of the pattern.
An effective bullish engulfing pattern is followed by a third candle (bullish), which breaks above the body of the engulfing candle. An effective bearish engulfing pattern is followed by a third candle (bearish), which breaks below the body of the engulfing candle. As shown in the figure below, this is the representation of engulfment confirmation on the chart:
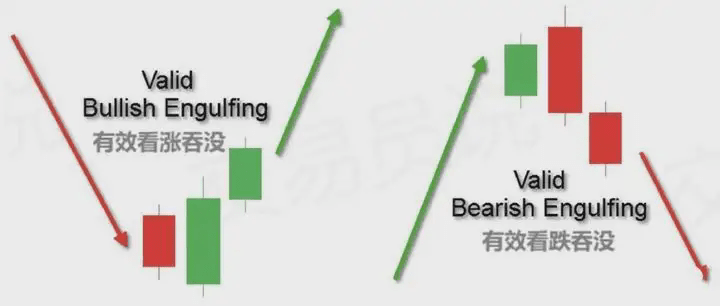
Please note that this time we saw the confirmation candle after the pattern. When you observe this candle behavior after the engulfing pattern, it will confirm the validity of the pattern.
Engulfing pattern trading strategy
We have explored the structure of the engulfing pattern in detail. Now let’s discuss the trading strategies related to this chart pattern.
Entry for engulfing pattern trades
The entry point for the trade is usually when the engulfing pattern is confirmed. This is the third candle (the one after the engulfing candle), which should break above the body of the engulfing candle and move in the expected direction. When the candle closes beyond this level, we confirm the pattern and can open the corresponding trade.
If the engulfing pattern is bearish, the price breakout should be below the body of the engulfing candle. In this case, we should prepare to short the trade. If the engulfing pattern is bullish, the price breakout should be above the body of the engulfing candle. This means we should go long.
Setting stop losses for the engulfing pattern
Without exception, controlling risk should be your top priority in trading. Therefore, your engulfing trade must have a stop loss set.
The best stop loss position in engulfing trades is outside the extremes of the engulfing pattern. If the engulfing pattern is bullish, the stop loss should be set below the lower shadow of the engulfing candle. If the engulfing pattern is bearish, the stop loss should be set above the upper shadow of the engulfing candle.
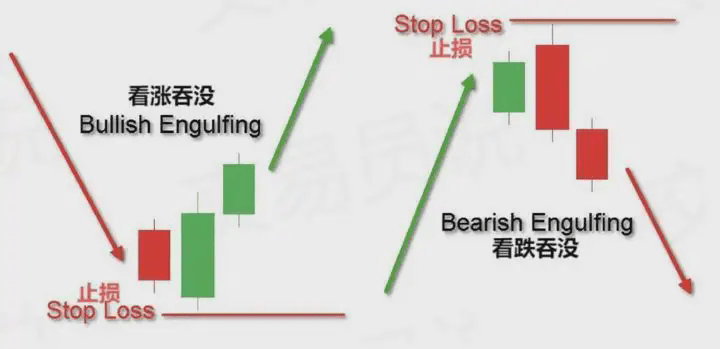
The above chart shows how to set stop losses when trading bullish and bearish engulfing patterns. If the price fails to move in the expected direction and triggers the stop loss, it will prove that the trading hypothesis is incorrect while protecting your capital from minimal losses.
Setting take profit for the engulfing pattern
A rule of thumb is that engulfing trades should be held at least until the price movement is equal to the size of the pattern. This means that the minimum take profit target pursued from the engulfing pattern should equal the distance between the upper and lower shadows of the engulfing candle.
When the price movement reaches this distance, you can choose to close all or part of your position. If you choose to hold part of the position, you need to carefully observe the price movement for potential exit opportunities. This includes support/resistance breakouts and trend or channel breakouts. Chart patterns and candlestick formations are also very important here. If you find chart/candlestick patterns that contradict your current trade, you may need to close the position.
Engulfing patterns and price action strategies
Now let’s illustrate price action-based trading strategies in conjunction with engulfing patterns. Please see the figure below:
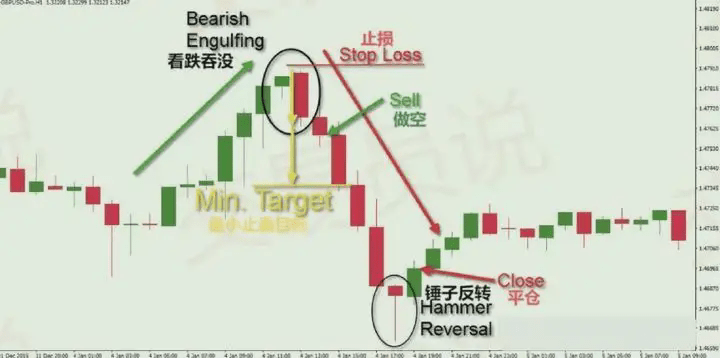
The above chart is the hourly chart of GBP/USD (British Pound/US Dollar) from January 1 to January 5, 2016. The chart depicts a bearish engulfing pattern and its trading rules.
The chart starts with a price increase, marked by the green arrow in the chart. You will notice that the price movement only formed bullish candles. Suddenly, we see a relatively large bearish candle that completely engulfs the previous candle. This confirms the presence of a bearish engulfing pattern on the chart.
However, in this case, we need to see the confirmation candle before we can consider entering a position. The next candle on the chart is again bearish, closing below the body of the engulfing candle. This is the confirmation required for trading the bearish engulfing pattern. The stop loss for this trade should be set above the upper shadow of the engulfing candle, as shown in the figure above.
The yellow arrow in the chart shows the size of the pattern and how to apply the minimum take profit target on the chart. This target is achieved in the next candle that appears after the engulfing confirmation.
This trade can be extended for more profit. You can use price action rules to determine the final exit signal. You will notice that the GBP/USD price formed two more large bearish candles on the chart, which would double the trade profit. However, the next candle on the chart is a hammer reversal pattern, also known as a Pin Bar, which has strong bullish potential. When the hammer pattern is confirmed, the trade should be closed. As you can see, the next candle is bullish and breaks above the hammer pattern's level. This confirms the validity of the hammer reversal, generating an exit signal to close the short position. The bearish engulfing trade should be closed at the closing of the bullish candle after the hammer pattern, as indicated by the second red arrow in the figure above.
This example shows how price action rules help find the most suitable exit points on the chart.
Engulfing patterns and support and resistance
Another effective method for trading engulfing patterns with price action is to find the pattern at key support and resistance levels.
If the price is close to a resistance zone while a bearish engulfing pattern appears on the chart, it will create very strong bearish potential on the chart. Conversely, if the price is close to a support level while a bullish engulfing pattern appears on the chart, it will create very strong bullish potential on the chart.
These situations provide a high probability of success for trading. Many times, when you enter at the right time and in a situation of technical convergence, you can enter early into a new emerging trend reversal. Now let’s see how to combine the engulfing pattern with support and resistance levels:
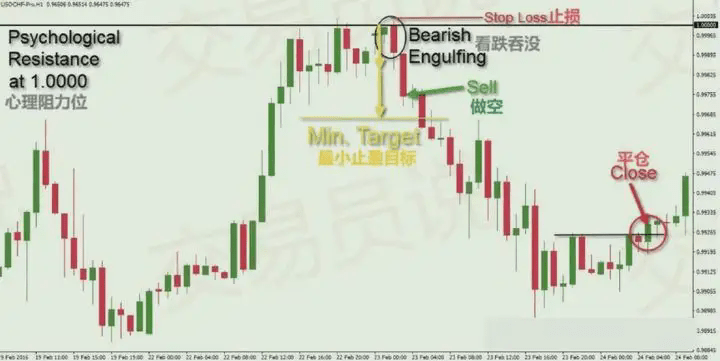
The chart above is the hourly chart of USD/CHF (US Dollar/Swiss Franc) from February 19 to February 24, 2016. It shows another bearish engulfing trade that occurred after the price reached a psychological resistance level.
The black horizontal line in the chart represents a very strong psychological resistance level at the 1.0000 parity rate of USD/CHF. After a strong price rise, USD/CHF encountered this resistance level and subsequently tested it twice more. On the third test of this resistance level, the price formed a relatively large bearish candle that engulfed the previous bullish candle. This formed a bearish engulfing pattern on the chart.
The confirmation of the bearish engulfing occurs in the next candle, which is bearish and breaks below the body of the engulfing candle. The closing of the confirmation candle provides a short entry signal.
The stop loss should be set above the upper shadow of the engulfing candle, slightly above the 1.0000 level.
After that, the price begins to decline. The minimum take profit target of the subsequent pattern is reached (as indicated by the yellow arrow). You can close part of the position here and retain part of the position in anticipation of further price declines.
Note that USD/CHF continued to form lower highs and lower lows during the decline, which provided confidence for the downtrend. Suddenly, the price movement began to consolidate, and we marked the upper limit of the range with a thin black horizontal line. Once the price breaks this resistance and closes above it, the trade should be closed immediately. As you can see, this forms a higher peak on the chart, suggesting that the bearish trend may be interrupted.
Combining support and resistance levels with engulfing patterns is a very excellent price action-based trading method.
Let's look at another example of a bullish engulfing pattern for EUR/USD: As you can see, the bullish engulfing candlestick pattern exists, indicating a potential buying opportunity.
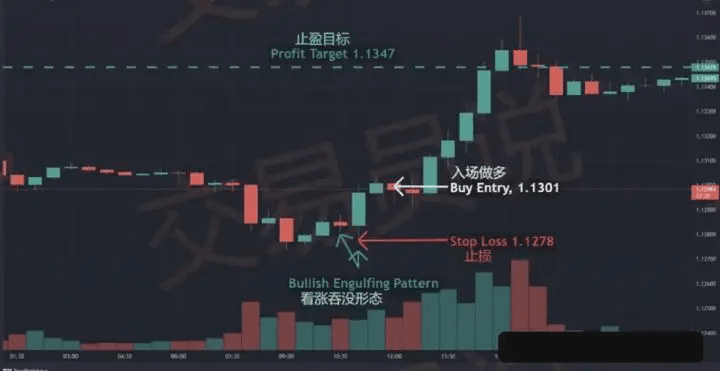
The above trade is executed through the following steps:
1. Identify the bullish engulfing pattern.
2. Execute a buy at the price level of 1.1301 after confirming the pattern.
3. Set the profit target at 1.1347 based on a risk-reward ratio of 1:2.
4. The stop loss is set at 1.1278, below the lower shadow of the second bullish candle.
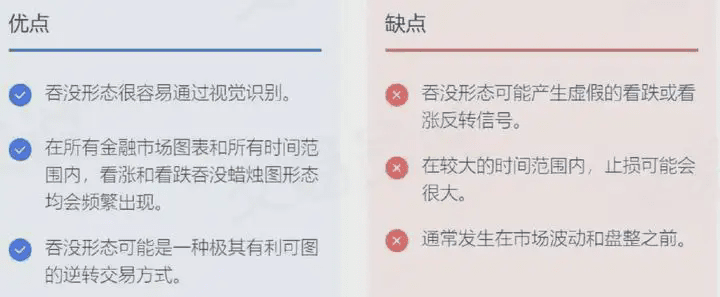
Engulfing candlestick patterns: Pros and Cons
Bullish and bearish engulfing candlestick patterns each have their advantages and disadvantages, as shown in the figure below:
Summary
The engulfing candlestick pattern is a double candlestick pattern. It consists of two candles, with the second candle completely engulfing the first candle, including the shadows. The engulfing candlestick pattern has strong reversal potential on the chart. We identify two types of engulfing candlestick patterns:
◎ Bearish engulfing: can be found at the end of an uptrend. It starts with a bullish candle, followed by a larger bearish candle whose body completely engulfs the first candle in the pattern. This creates bearish (reversal) potential on the chart.
◎ Bullish engulfing: can be found at the end of a downtrend. It starts with a bearish candle, followed by a larger bullish candle whose body completely engulfs the first candle in the pattern. This creates bullish (reversal) potential on the chart.
The confirmation of the engulfing pattern occurs in the next candle on the chart:
◎ If the engulfing pattern is bullish, the next candle should be bullish, and its closing price should be above the body of the engulfing candle.
◎ If the engulfing pattern is bearish, the next candle should be bearish, and its closing price should be below the body of the engulfing candle.
Here are three basic rules for engulfing trades:
◎ Open the trade when the price closes on the confirmation candle.
◎ Set stop loss orders outside the opposing side of the engulfing pattern.
◎ The minimum price movement to hold the trade is equal to the size of the engulfing pattern, or use price action rules to extend the trade duration.
The high-probability price action method for trading bullish and bearish engulfing patterns is to look for these patterns at significant support and resistance levels.
