Dogecoin has confirmed a breakout above the $0.23 double bottom, supported by the golden cross and rising trading volume, with a bullish target set at $0.418, indicating strong upward momentum.
Dogecoin breaks above the $0.23 neckline, confirming the double bottom pattern with a target price of $0.418.
The weekly candle has confirmed $0.23 as a new support level, reinforcing the bullish momentum.
The formation of the golden cross enhances DOGE's technical upward trend, supported by increased trading volume.
Dogecoin confirms a breakout of the $0.23 double bottom and hits the golden cross support level, with a target price of $0.418. Follow COINOTAG for professional cryptocurrency news and analysis.
Is Dogecoin's double bottom breakout signaling a new round of increases?
Dogecoin (DOGE) has recently successfully broken through the critical neckline of $0.23, forming a typical 'double bottom' structure, which is a strong bullish signal.
The confirmation of this technical pattern means that bullish forces are taking the initiative, and market buying sentiment has clearly warmed up.
From the weekly chart, the price has consistently closed above the neckline, indicating a valid breakout. Additionally, the original strong resistance at $0.23 has now turned into a support level, providing solid backing for future price movements.
According to the technical measurements of the double bottom pattern, Dogecoin is expected to challenge the target of $0.418 in the short term. If market sentiment remains optimistic, this target is highly likely to be realized.
Overall, this double bottom breakout not only enhances market confidence but also lays the foundation for a new upward cycle for DOGE. Investors can continue to monitor its trend to seize potential opportunities.
Is Dogecoin experiencing a 'golden cross', signaling an impending upward trend?
Recently, Dogecoin (DOGE) welcomed an important technical signal—the golden cross, where the 50-day exponential moving average (EMA50) crosses above the 200-day moving average (EMA200). This phenomenon is widely viewed as a bullish indicator in technical analysis, suggesting the possibility of a long-term upward trend.
This golden cross not only confirms DOGE's current upward momentum but also enhances market confidence to some extent. Particularly against the backdrop of increased trading volume, bullish strength is further consolidated, providing solid support for the price.
For investors, this signal usually indicates the beginning of a trend reversal or a continuation of the upward trend. If subsequent market sentiment continues to align, Dogecoin is expected to further challenge higher target levels.
Key technical analysis behind Dogecoin's breakout—double bottom pattern confirms a new phase of upward movement.
Recently, the price trend of Dogecoin (DOGE) has garnered significant market attention. Trader Tardigrade's analysis of Dogecoin's weekly chart indicates that DOGE has formed and confirmed a typical double bottom pattern, with the neckline located around $0.23. This technical signal provides strong support for subsequent price increases.
The double bottom pattern is one of the classic reversal patterns, typically signaling the end of a downtrend and the beginning of a new upward phase.
In the case of DOGE, this pattern began near two significant lows around $0.12, followed by a rebound that formed a symmetrical and effective bottom structure. This structure indicates strong buying support around this price level, with bulls gradually gaining an advantage.
More critically, Dogecoin's price not only successfully broke through the $0.23 neckline but also underwent a retest of that neckline.
The weekly chart shows that this week's closing price stabilizes above the neckline, with a noticeable lower shadow, indicating that the neckline position has been recognized and effectively defended as a support level by the market. This retest confirms that previous resistance has turned into support, which is a very positive signal in technical trends.
According to standard technical analysis methods, the target price for the double bottom pattern is the height of the bottom structure added to the breakout point.
Based on this DOGE pattern calculation, the target price is approximately $0.418. This means that if the market develops as expected according to the pattern, DOGE is likely to continue climbing toward this target.
This technical breakthrough reflects not only the confirmation of the graphical pattern but also the active market buying and the heightened confidence of investors.
Breaking the neckline and successfully retesting often attracts more funds, pushing prices above resistance levels. Additionally, the accompanying trading volume is also an important factor in validating the effectiveness of the breakout. Observing DOGE's recent trading volume reveals an increase in market participation, providing solid support for the price.
In summary, Dogecoin's double bottom pattern not only marks a key turning point in the market but also lays a solid foundation for future upward trends.
Investors should continuously monitor whether the price can maintain above the neckline. If support can be firmly held, the target of DOGE reaching $0.418 will be just around the corner. At the same time, attention should also be paid to the overall market environment and capital flow to flexibly adjust investment strategies.
Market data strongly supports the bullish outlook for Dogecoin.
Recently, the market performance of Dogecoin (DOGE) has attracted widespread attention. According to the latest data from CoinGecko, DOGE's current trading price is $0.2421, up 2.8% within 24 hours. Meanwhile, trading volume has reached $3.03 billion, with a market capitalization of $36.39 billion, firmly ranking among the top ten cryptocurrencies globally.
These data not only reflect the market activity of DOGE but also demonstrate its strong capital inflow and investor confidence.
The market data reflects the result of multiple factors at play. Firstly, the continuous growth in trading volume indicates that more funds are entering the Dogecoin market, increasing buying and selling activity. This not only enhances price stability but also provides a solid foundation for subsequent increases.
High trading volume typically signifies ample market liquidity, allowing investors to enter and exit positions more smoothly, reducing the risks associated with price volatility.
Secondly, maintaining a market capitalization within the top ten reflects Dogecoin's status and influence as a mainstream crypto asset. This not only attracts more attention from institutions and retail investors but also enhances its recognition in the market. The robust performance of market capitalization lays a solid foundation for price increases.
Source: Antonio Costa (X)
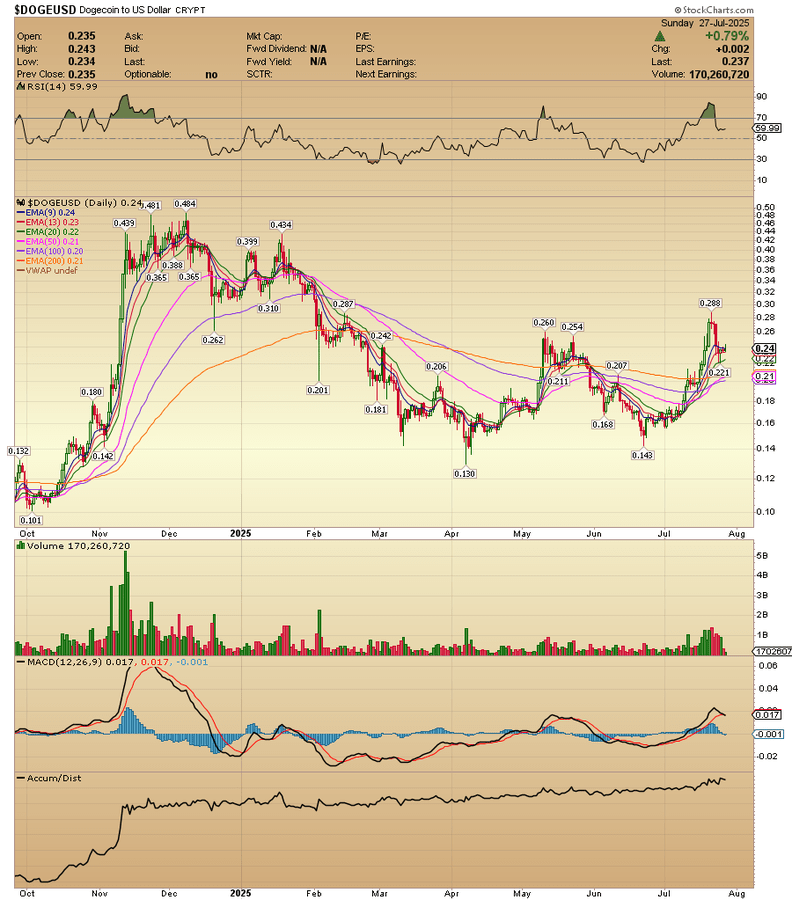
From a technical perspective, senior analyst Antonio Costa observed that Dogecoin recently displayed a classic 'golden cross' phenomenon—where the 50-day exponential moving average (EMA50) successfully broke above the 200-day moving average (EMA200).
This technical indicator is widely regarded as a strong bullish signal, representing a robust return of bullish forces and the confirmation of a long-term upward trend. The golden cross not only boosts market sentiment but also attracts more capital inflow, creating a virtuous cycle.
Combining the current price trend, Dogecoin is firmly standing above the critical support level of $0.23, which provides strong support for its future upward path.
As long as the price can remain above this level, the market will continue to be optimistic about reaching target levels of $0.28 or even $0.418. Technical analysis shows that these two price targets are based on the breakout heights of previous key resistance turning into support, with a high probability of realization.
Additionally, on-chain data and market sentiment indicators further corroborate this optimistic trend.
Bullish funds continue to flow in, with holders not selling off en masse, reflecting investor confidence in Dogecoin's medium to long-term prospects. The fear and greed index is also at a high level, indicating an overall optimistic market sentiment.
In summary, the current market data and technical signals provide solid support for Dogecoin's future upward trend.
For investors, this means that there is still good value for entry and holding, provided that risks are managed appropriately. It is important to note that the crypto market is highly volatile, and it is advisable to monitor changes in key support and resistance levels, adjusting position strategies flexibly.
In summary, Dogecoin is standing at a new upward starting point due to strong trading volume, stable market capitalization, and key technical breakthroughs. As long as bullish forces continue to accumulate, price targets of $0.28 and $0.418 will no longer be distant, warranting close attention from investors.
Frequently Asked Questions
What price target does Dogecoin's double bottom pattern suggest?
The price target set by the double bottom breakout is approximately $0.418, calculated by measuring the height of the pattern and adding it to the $0.23 breakout level.
Why is the golden cross important for Dogecoin traders?
The golden cross indicates a shift towards bullish momentum, helping traders identify potential long-term upward trends and confirming buy signals.
Key Points
The double bottom breakout has been confirmed: the weekly closing price is above $0.23, validating the bullish pattern.
Golden cross supports momentum: EMA50 crossing EMA200 indicates a strong upward trend.
Target price set at $0.418: pattern measurement predicts significant upward potential.
Conclusion
The confirmed double bottom breakout and golden cross pattern of Dogecoin highlight a strong bullish trend, driven by robust trading volume and market data.
Maintaining the price above $0.23 is crucial for continuing the move towards the target of $0.418. As Dogecoin remains a leader in the cryptocurrency market, investors should closely monitor these key levels for potential entry points.