📉 1. Resistance / Support Conversion (Bearish Signal)
When a support line breaks and becomes a resistance, it signals that the price may drop further. Traders often interpret this as a bearish trend forming.
---
🔼 2. Triangle (Upward Coil – Bullish)
This pattern shows consolidation followed by a breakout. An upward coil usually suggests the bulls are preparing to push the price higher.
---
🔽 3. Triangle (Downward Coil – Bearish)
Opposite of the upward coil, this one signals potential downward momentum, often confirming bearish pressure.
---
📈 4. Bollinger Bands
Bollinger Bands measure volatility. When the price moves outside the upper or lower band, it might be overbought or oversold—a possible sign of reversal or trend continuation.
---
🔺 5. Wedge Patterns
Rising Wedge (Bearish): Signals a potential downward breakout.
Falling Wedge (Bullish): Indicates a bullish reversal may be coming.
---
🔲 6. Trendy Range (Box Pattern)
When price stays within a horizontal box, it suggests accumulation or distribution:
Bullish box breakout = potential uptrend
Bearish box breakdown = potential downtrend
---
🕯️ Here is the candles image 👇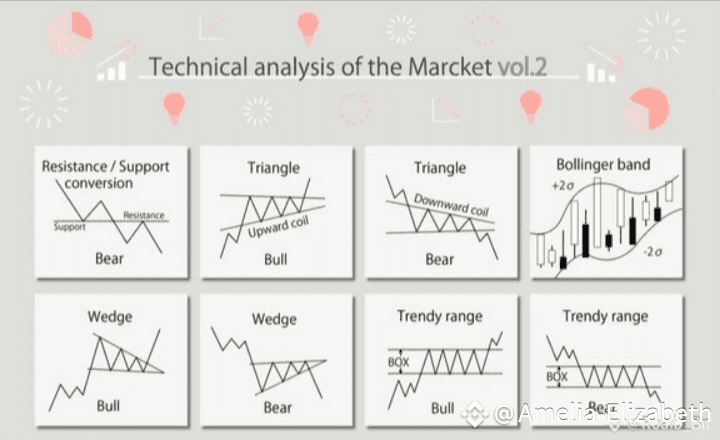
---
✅ Final Words:
Technical analysis doesn’t predict the future—it helps you understand possibilities based on patterns and price action. Combine these insights with good risk management and your own strategy.
---
If you found this post helpful, please don’t forget to: 👉 Like
💬 Comment your thoughts
👥 Follow for more actionable crypto insights!
Thanks for reading! 👍
#CryptoScamSurge #AmericaAIActionPlan #BTRPreTGE #CryptoClarityAct #TrumpBitcoinEmpire
