Analysis of $RIF /USDT 1-Hour Chart .
Price Action
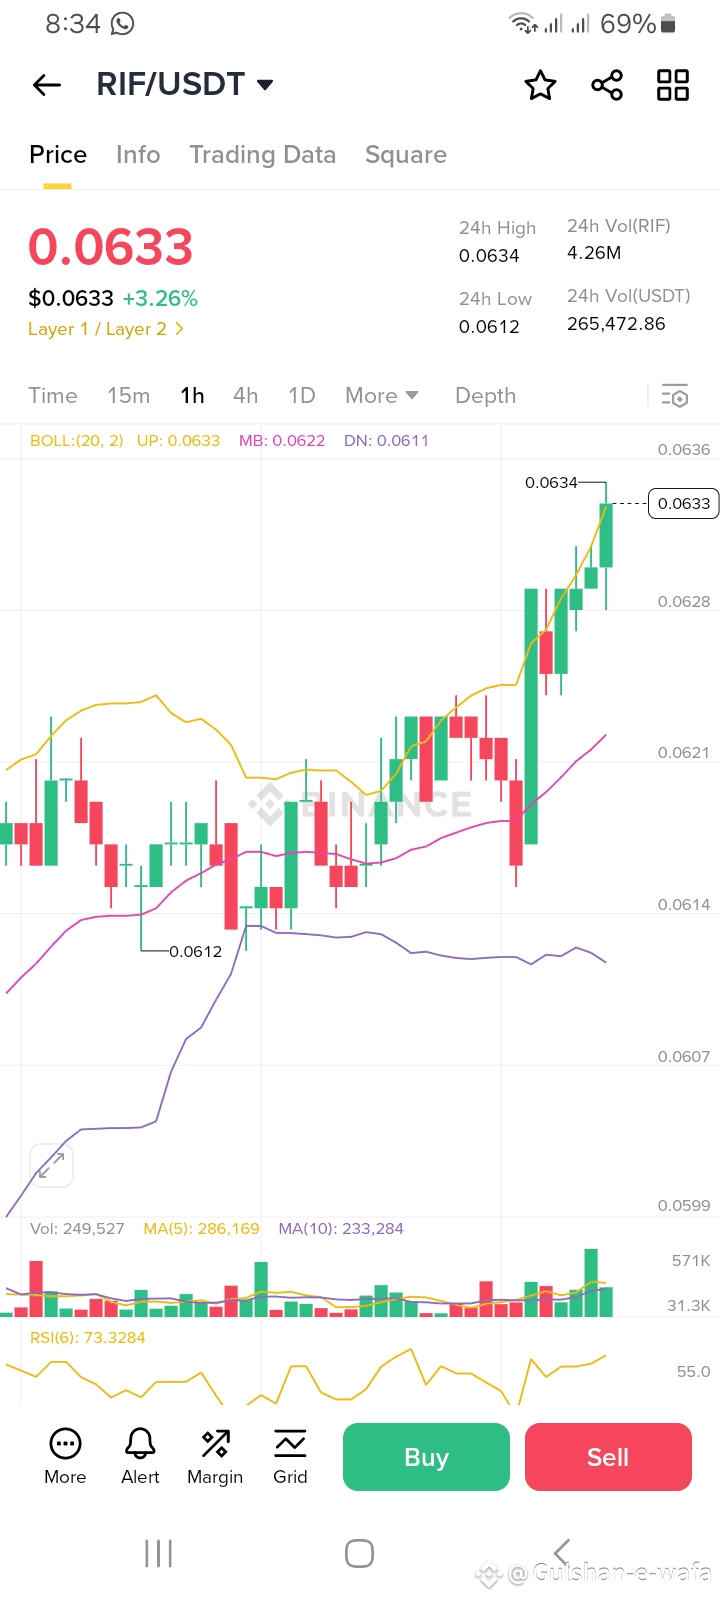
Current Price: The price of RIF/USDT is currently at 0.0633 USDT, reflecting a 3.26% increase within the last 24 hours.
Trend: The chart shows a strong uptrend in recent hours. The price has surged from a recent low of approximately 0.0612 USDT and has broken above the upper Bollinger Band at 0.0633 USDT, indicating robust bullish momentum.
24-Hour Range: The price is near the 24-hour high of 0.0634 USDT, with the 24-hour low at 0.0612 USDT, suggesting it has recovered significantly from its lowest point in the period.
Volume
Current Volume: The most recent 1-hour candlestick shows a significant spike in trading volume to 571,000 RIF, a sharp increase compared to the 24-hour total of 4.26 million RIF (equivalent to 265,472.86 USDT).
Moving Averages: The 5-period MA for volume is 286,169, and the 10-period MA is 233,284, with the current volume of 249,527 (as noted in the chart settings) being an average over recent periods. However, the spike to 571K indicates a burst of activity in the latest hour.
Interpretation: This volume surge aligns with the price increase, suggesting strong buying interest driving the uptrend.
Relative Strength Index (RSI)
Current Value: The RSI is at 73.3284, which is above the 70 threshold, classifying the asset as overbought.
Trend: The RSI has been trending upward alongside the price, reflecting growing momentum.
Implication: An RSI above 70 often signals a potential pullback or consolidation, as the asset may be overstretched. However, in strong trends, RSI can remain elevated for extended periods.
Bollinger Bands
Settings: The Bollinger Bands are set with a length of 20 and a standard deviation of 2.
Upper Band: 0.0633 USDT (coinciding with the current price)
Middle Band: 0.0622 USDT
Lower Band: 0.0611 USDT
Observation: The price breaking above the upper band suggests increased volatility and strong upward momentum. This can indicate either a continuation of the trend if momentum persists or a potential reversal if buying pressure wanes.
Band Width: The widening of the bands (upper band rising relative to the lower band) confirms heightened volatility in recent price action.
Support and Resistance Levels
Resistance: The 24-hour high at 0.0634 USDT is an immediate resistance level. A sustained break above this could signal further upside.
Support:
The middle Bollinger Band at 0.0622 USDT may act as near-term support if the price pulls back.
The recent low at 0.0612 USDT, close to the lower band at 0.0611 USDT, represents a stronger support zone based on prior price action.
Key Insights
Bullish Momentum: The break above the upper Bollinger Band, coupled with a significant volume spike, indicates a strong bullish phase. The price nearing the 24-hour high reinforces this sentiment.
Overbought Conditions: The RSI at 73.3284 suggests the asset is overbought, raising the possibility of a short-term correction or consolidation.
Volatility: The Bollinger Bands widening and the price exceeding the upper band highlight increased market volatility, which could lead to sharp movements in either direction.
Potential Scenarios
Trend Continuation: If buying pressure persists and the price breaks above 0.0634 USDT with sustained high volume, further gains are possible. The strong momentum and volume support this scenario.
Pullback: Given the overbought RSI, a retreat toward the middle band (0.0622 USDT) or the recent low (0.0612 USDT) could occur as traders take profits or momentum cools.
Consolidation: The price might stabilize around current levels (near 0.0633–0.0634 USDT), allowing the RSI to moderate before the next directional move.
Conclusion
The RIF/USDT pair is currently experiencing a strong uptrend, driven by significant buying volume and a break above the upper Bollinger Band at 0.0633 USDT. However, the RSI of 73.3284 indicates overbought conditions, suggesting caution for a potential pullback or consolidation in the near term. Traders should monitor:
Volume trends: Continued high volume could support further upside.
Price levels: A break above 0.0634 USDT signals bullish continuation, while a drop below 0.0622 USDT may indicate a reversal.
RSI: A decline from overbought levels could confirm a correction.