Let’s learn from scratch about candlesticks to build your conceptual foundation.
What is a Candlestick Pattern?
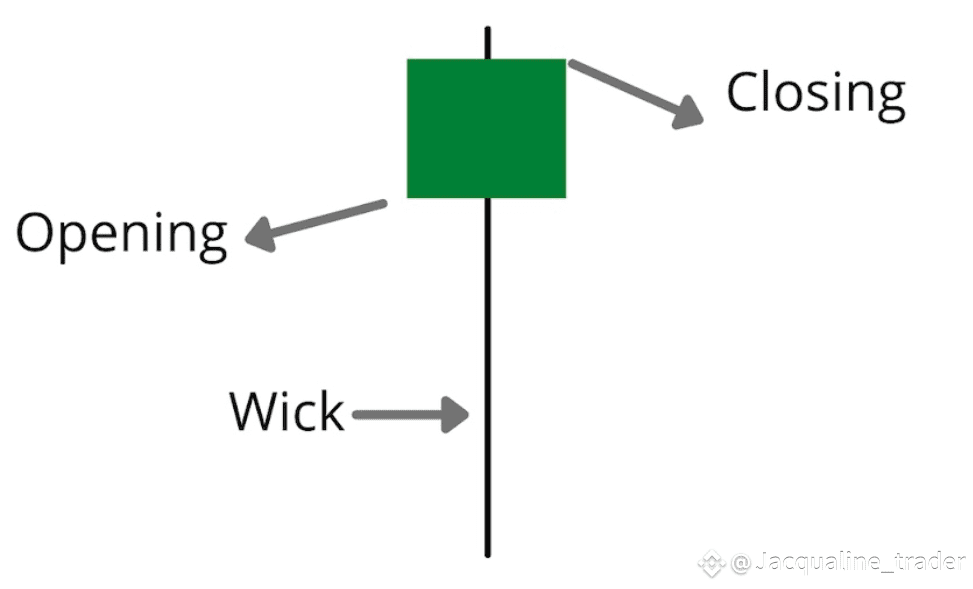
A candlestick pattern shows price action over a certain period. It comprises of four parts:
Open: The price at which the period begins.
High: The highest price reached during the period.
Low: The lowest price reached during the period.
Close: The final price at the end of the period.
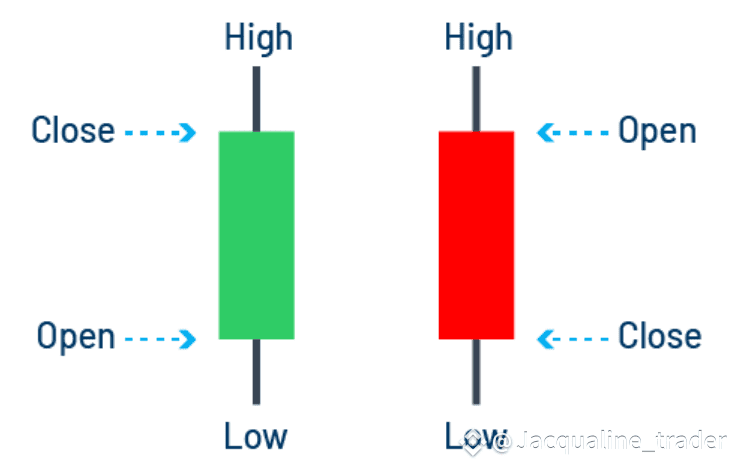
Each candle gives you a clue about market sentiment. If the close of a candle is higher than the open price, it is considered a bullish candle and is represented by green color. It indicates buyers are in control. On the other hand, if the close price is below the open price, it shows the sellers are in control, and the candle's color is red.
Candlesticks are important for traders because they represent the market sentiment visually, whether buyers dominate or sellers do not.
-------Types of Candlestick Patterns-------
We categorize the candlestick patterns into three parts. Let’s take a look:
Single Candlestick Patterns
Single candlestick patterns give you insight based on one price bar.
Doji
It indicates indecision in the market as the open and close prices are almost the same.
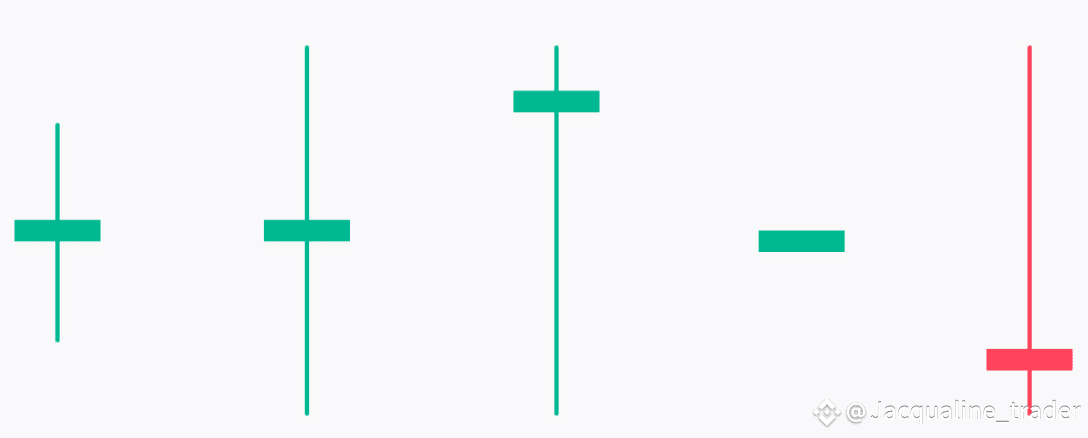
Hammer
It is a bullish pattern that appears after a downtrend. It indicates that the selling was exhausted, and buyers had stepped in. The color of the candle does not matter. The only thing that matters is a long wick with a small body at the bottom. Usually, the wick size is three times the size of the body.
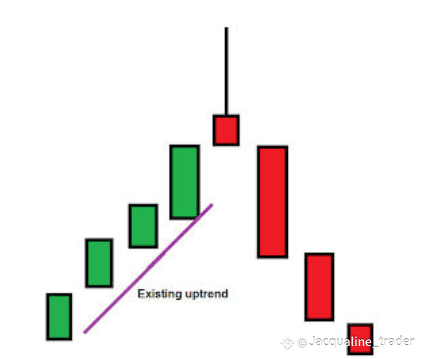
Shooting Star
It is a bearish reversal pattern that appears after an uptrend. It shows a potential selling pressure. It has a long wick on the upside and a small body.
Double Candlestick Patterns
Patterns with two candlesticks represent strong reversal and continuation signals.
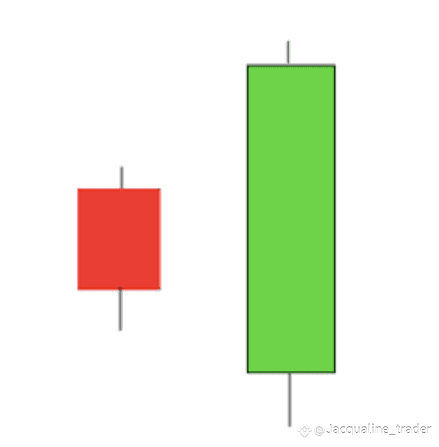
Bullish Engulfing
It is a big size bullish candle that covers the previous candle. It indicates a strong buying momentum.
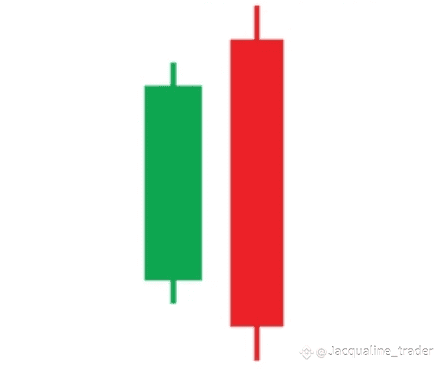
Bearish Engulfing
It is a large bearish candle that covers the previous candle. It indicates a strong selling momentum.
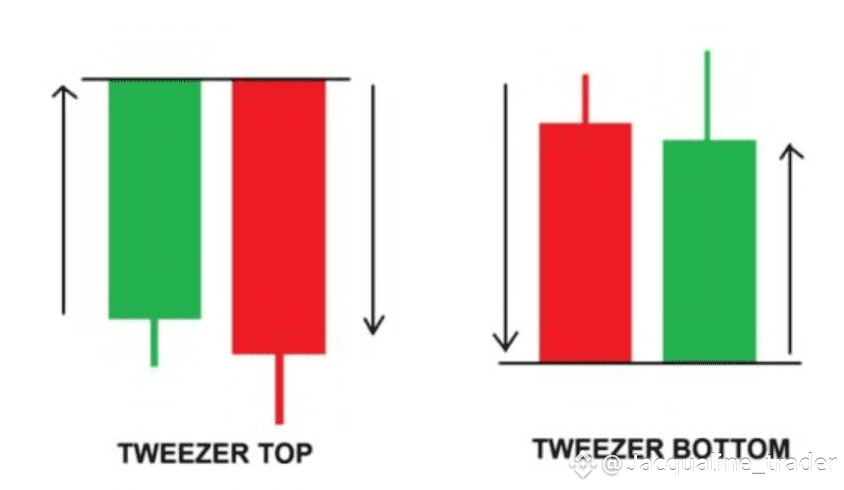
Tweezer Tops & Bottoms
It occurs at the end of an uptrend or downtrend and signals a trend reversal. Two identical candles with different colors represent the tweezers.
Triple Candlestick Patterns
Coming soon in next article....
Note: this is only for educational purpose!!
#EducationalPost #candlestick_patterns #ETHReclaims3800