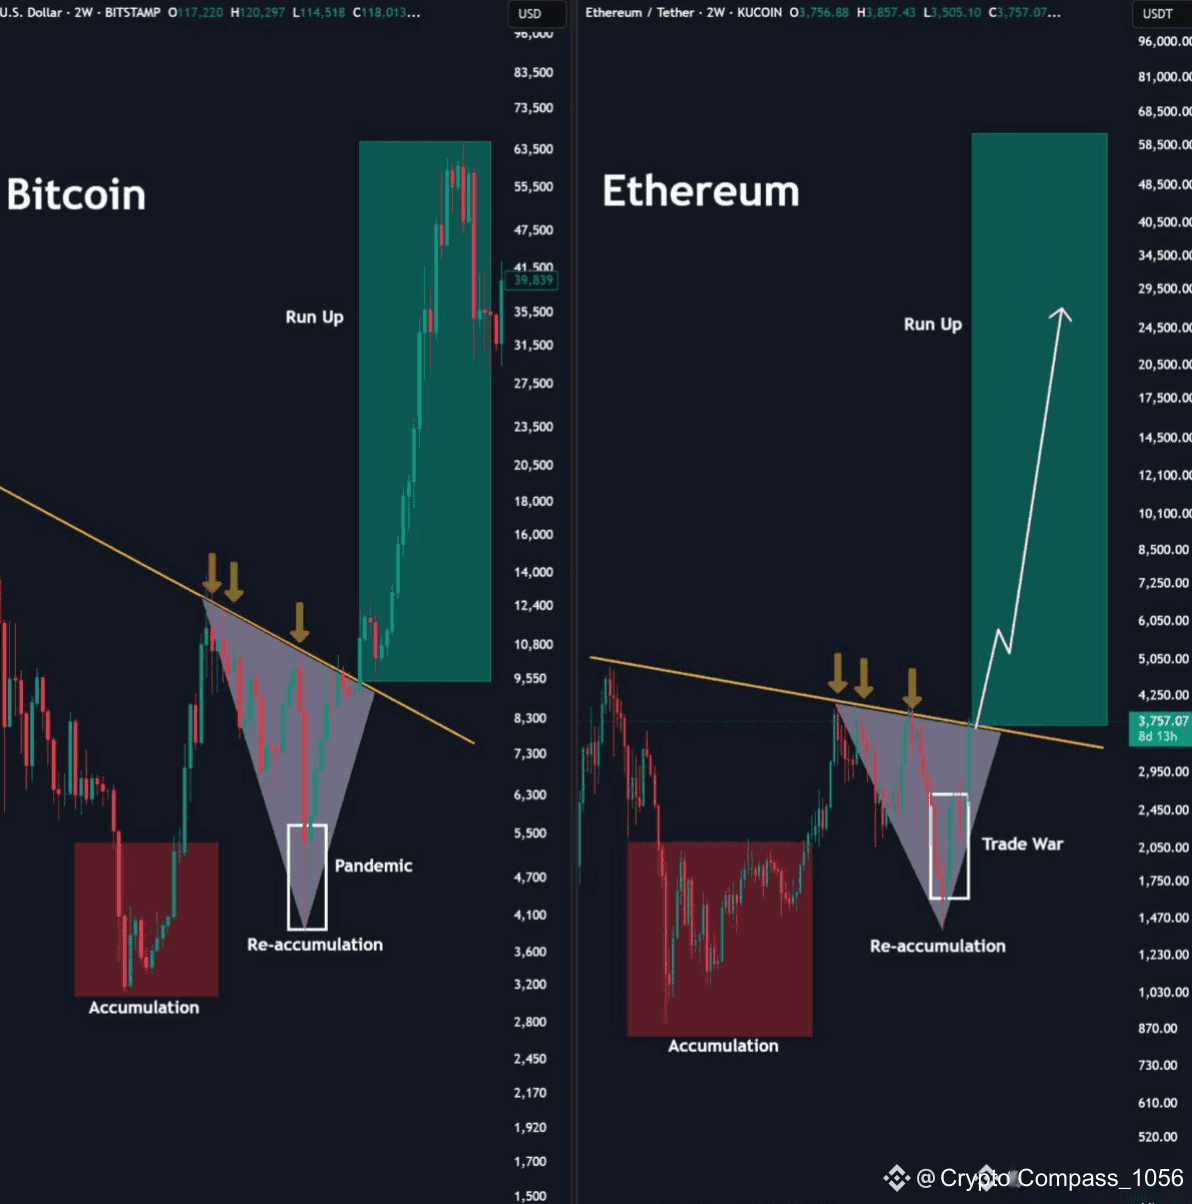
This powerful chart comparison between Bitcoin’s historic 2020 run and Ethereum’s current setup is screaming bullish momentum! On the left, we see how BTC broke out of a long-term descending trendline after a pandemic-induced re-accumulation phase — triggering a monster rally from ~$9.5K to over $65K.
Now, look at $ETH : it’s printing the same pattern — a long accumulation zone, a re-accumulation phase during the trade war, and multiple rejections at a descending trendline. But guess what? ETH is now right at the breakout point.
📈 If history rhymes, ETH could enter a parabolic phase, potentially targeting $20,000+ long-term as momentum builds and macro conditions ease. The setup is nearly identical — and we all know what came after for BTC.
💼 Trading Strategy ($ETH ):
Entry Zone: $3,500–$3,800 (on breakout confirmation with strong volume)
Stop Loss: Below $3,150 (beneath re-accumulation zone)
Target 1: $5,000
Target 2: $8,000
HODL Moon Target: $20,000 🚀
🧠 With ETF buzz, decreasing $ETH on exchanges, and strong on-chain metrics, Ethereum may be on the cusp of repeating BTC’s legendary 2020 breakout.
⏳ Don't fade the setup — this could be the biggest trade of the cycle.
#ETHBreakout #EthereumTo20K #cryptochartcraft #altcoinseason

