
Let's take a look at market cycle indicators and the Rainbow Chart.
Despite Bitcoin rising to levels of $117,426 according to the Rainbow Chart, most market cycle indicators do not yet suggest that we have entered the 'bubble' or the historical peak.
On the contrary, indicators show that the market has not yet reached a peak of enthusiasm or overvaluation.
🔵 What does the Rainbow Chart tell us?
The current price location is within the dark blue/green zone, which ranges from $96,867 – $132,979. Historically, this area is considered a 'smart buying zone' or at least not a price bubble.
🔸 This means that:
The market has not yet entered the 'red zone' (very inflated prices).
There is significant potential for upward movement if previous cycle scenarios repeat.
Those who say we have 'reached the peak' may be rushing to judgment before peak signals are actually confirmed.
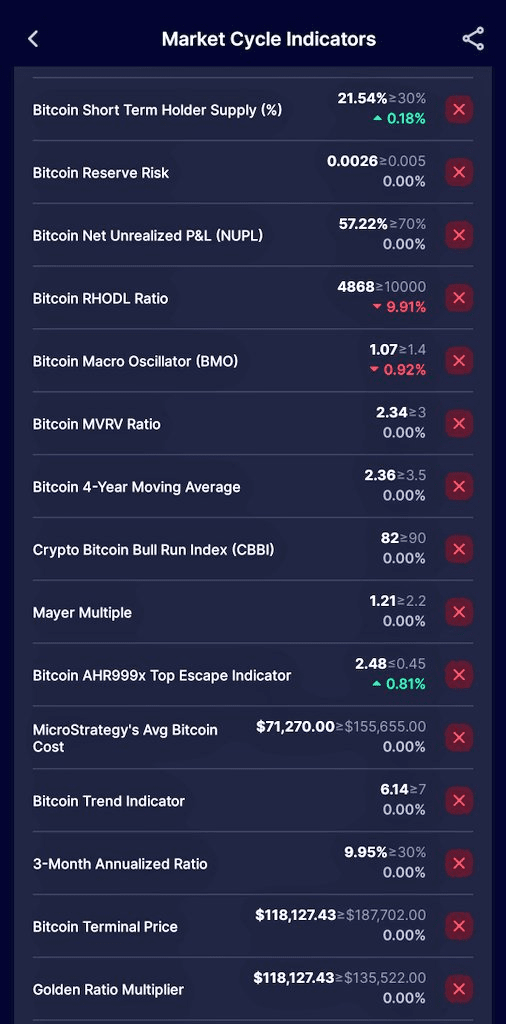
📌 Conversely, most cycle indicators are still below their historical targets:
NUPL is at 57.22% instead of ≥70%.
RHODL Ratio is at 4868 instead of 10000.
CBBI is at 82 (market peak historically ≥90).
Mayer Multiple is at 1.21 instead of ≥2.2.
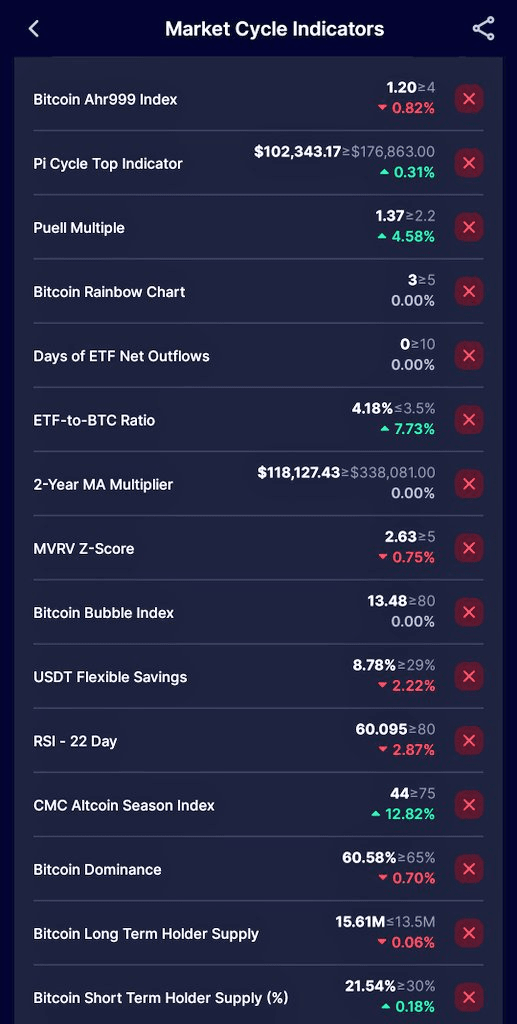
The AHR999x index is at 2.48 above the danger threshold of 0.45.
RSI - 22 days weakens to 60.05 with declining momentum.
🟢 Limited but promising positive signals:
The Puell Multiple is gradually rising to 1.37.
The price of Bitcoin is above MicroStrategy's average cost (≈ $71K), reflecting corporate confidence.
There are no signs of massive outflows from ETF funds so far (Days of Net Outflows = 0).
📌 General conclusion: Yes, the price is high compared to previous periods, but the big picture says that Bitcoin has not yet reached the cycle peak. Most technical and behavioral indicators have not entered the overbought territory, and there is a strong possibility that the market is still halfway through the journey.
It is wise here to combine optimism, caution, and discipline in risk management.