In trading, there are two states: either the market is asleep, or it is moving. And if you get into movement — that’s already half the success. The Alligator indicator helps to distinguish one from the other.
It was invented by Bill Williams, and the meaning he put in is simple: when the Alligator is asleep — it's better not to engage. But when it wakes up — be ready. This is exactly what the indicator shows.
How Alligator works
The Alligator consists of three lines — these are smoothed moving averages:
The blue (jaw) is more "lazy", it reacts to the price slowly.
The red (teeth) — of medium speed.
The green (lips) — the fastest.
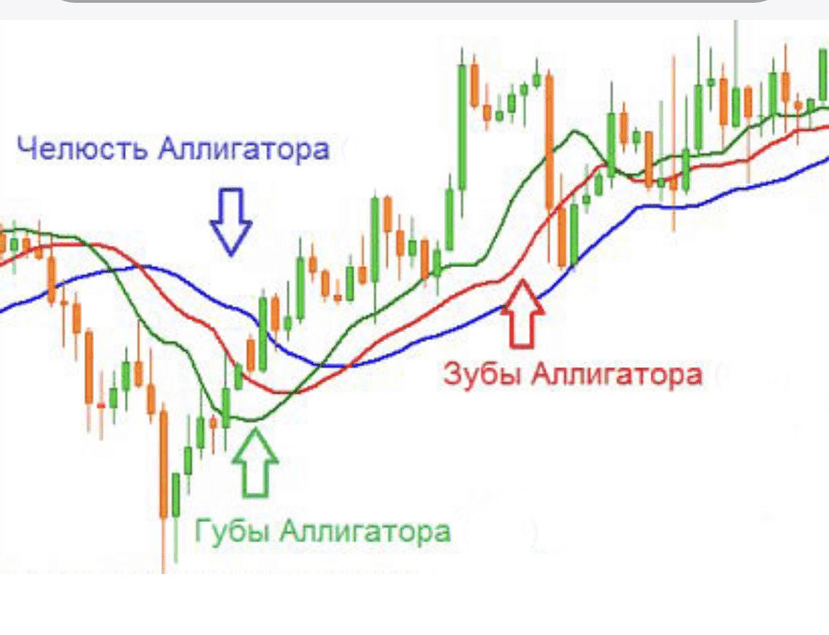
When the market is stagnant, these lines intertwine. The price oscillates back and forth, the lines hardly diverge — this is called "sleep". At such moments, most trades will be random and unprofitable.
But as soon as the green line starts to cross the red and blue, and the lines begin to diverge — this is a signal that movement is starting. Or, as they say, the Alligator has opened its mouth.
When to enter the trade
Basic logic:
📈 Long (rise):
The lips (green) cross the teeth and jaw from bottom to top.
All three lines begin to diverge upwards.
The price closes above these lines — this is a buy signal.
📉 Short (fall):
The lips cross the teeth and jaw from top to bottom.
The lines diverge downwards.
The candle closes below all three — a sell signal.
Important: the signal is considered reliable if the lines were tangled before (that is, the Alligator "was sleeping"). This means the market was accumulating energy — and is now ready to move.
Example on the chart👆
Here is a visual example of how this works:
It is clear here that:
At first, the lines are compressed — the market is not moving.
Then the green crosses two others.
The lines diverge — a trend appears.
The price goes up while the lines remain open.
As soon as the lips start to approach the teeth and jaw again — this is a sign that the movement is losing strength.
How to use it in practice
Wait for the lines to "sleep" for a long time (intertwined).
Watch for the crossing of the green line.
Confirm the price movement: the candle must close above (for long) or below (for short).
Enter on the next candle.
Stop can be set behind the indicator lines.
Exit — when the green crosses back or the lines begin to compress.
The main thing to remember
Alligator is not a "predictor", it is a filter. Its strength lies in showing: the time has come, it’s time to act.
Don't rush. The Alligator does not give signals every hour, but when it does — they are of high quality.
Better 1–2 trades on Alligator a week than 20 random ones.
Strategy based on the current situation of the Alligator (XRP, price 3.215)
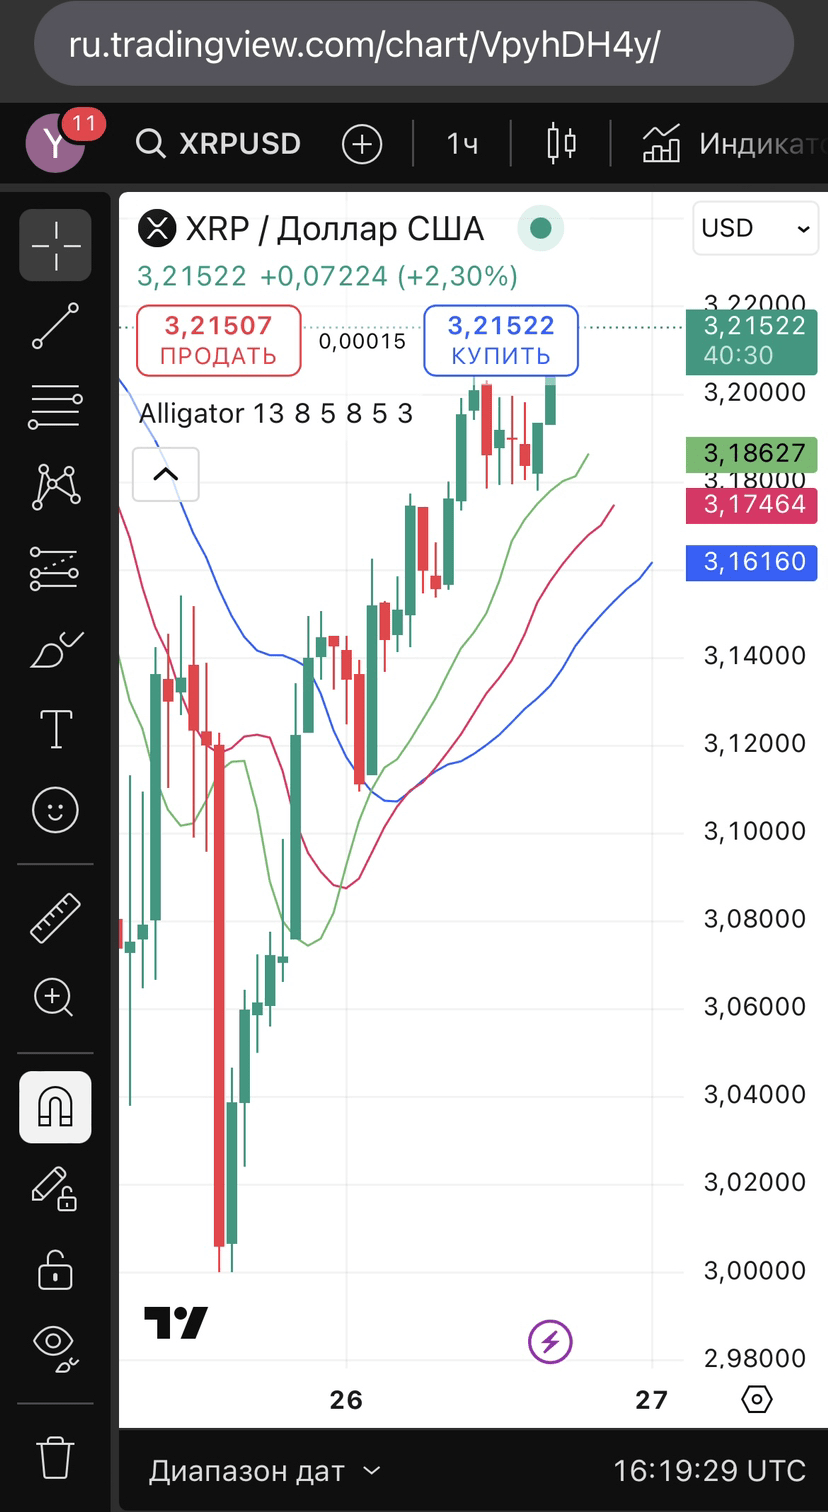
XRP/USDT on a 1-hour timeframe, current price: 3.21522 USDT. The Alligator indicator (13, 8, 5 / 8, 5, 3) shows:
The green line (lips) — above all.
The red (teeth) — below the green, but above the blue.
The blue (jaw) — the lowest.
Candles confidently trade above all three lines. This means the Alligator has "woken up", the mouth is open, and it is eating — that is, an upward trend is happening. This is a good moment to apply the strategy.
1. Conditions for entry
You see:
Three Alligator lines are diverging.
Candles close above all three lines.
No sideways movement, no crossings — everything is clear.
Conclusion: trend confirmed, you can enter long (for buying).
2. Entry into the trade
Let's say you enter at the market price — 3.215 USDT.
3. Stop loss and take profit
Set the stop loss slightly below the blue line (the lower boundary of the Alligator). Looking at the chart — the blue line is approximately at 3.161 USDT. Set the stop a bit lower — for example, at 3.155 USDT.
Set take profit at the next visual resistance. Based on the chart, you can aim for 3.280–3.290 USDT — as a target (approximate maximum of the previous move).
4. Profit and loss calculation
Difference in stop loss:
3.215 (entry) – 3.155 (stop) = 0.060 USDT loss per coin.
Difference in take profit:
3.280 – 3.215 = 0.065 USDT profit per coin.
Example 1: spot trading (without leverage)
You buy for 1000 dollars, at a price of 3.215. That’s about 311 XRP coins.
Profit if the price reaches take profit:
0.065 × 311 = $20.22Loss if it hits the stop loss:
0.060 × 311 = $18.66
Example 2: futures with 5x leverage
You control the same 1000 dollars, but in a position of 5000 USDT (5 times more). That's already 1555 XRP.
Profit in case of take profit:
0.065 × 1555 = $101.07Loss on stop loss:
0.060 × 1555 = $93.30
5. Application: spot or futures?
It can be applied both ways, but:
On spot — safer, without forced liquidations.
On futures — higher profit, but also higher risk. The main thing is to follow risk management.
Setting a stop is essential!
Exit by the indicator
If:
The lips (green) start to bend down,
Cross the teeth (red) from top to bottom,
the trend may be exhausted — exit the trade, even if the take profit is not reached.
P.S. Alligator (built into TradingView)