Technical Analysis: BOB$BTC
1. Current price:
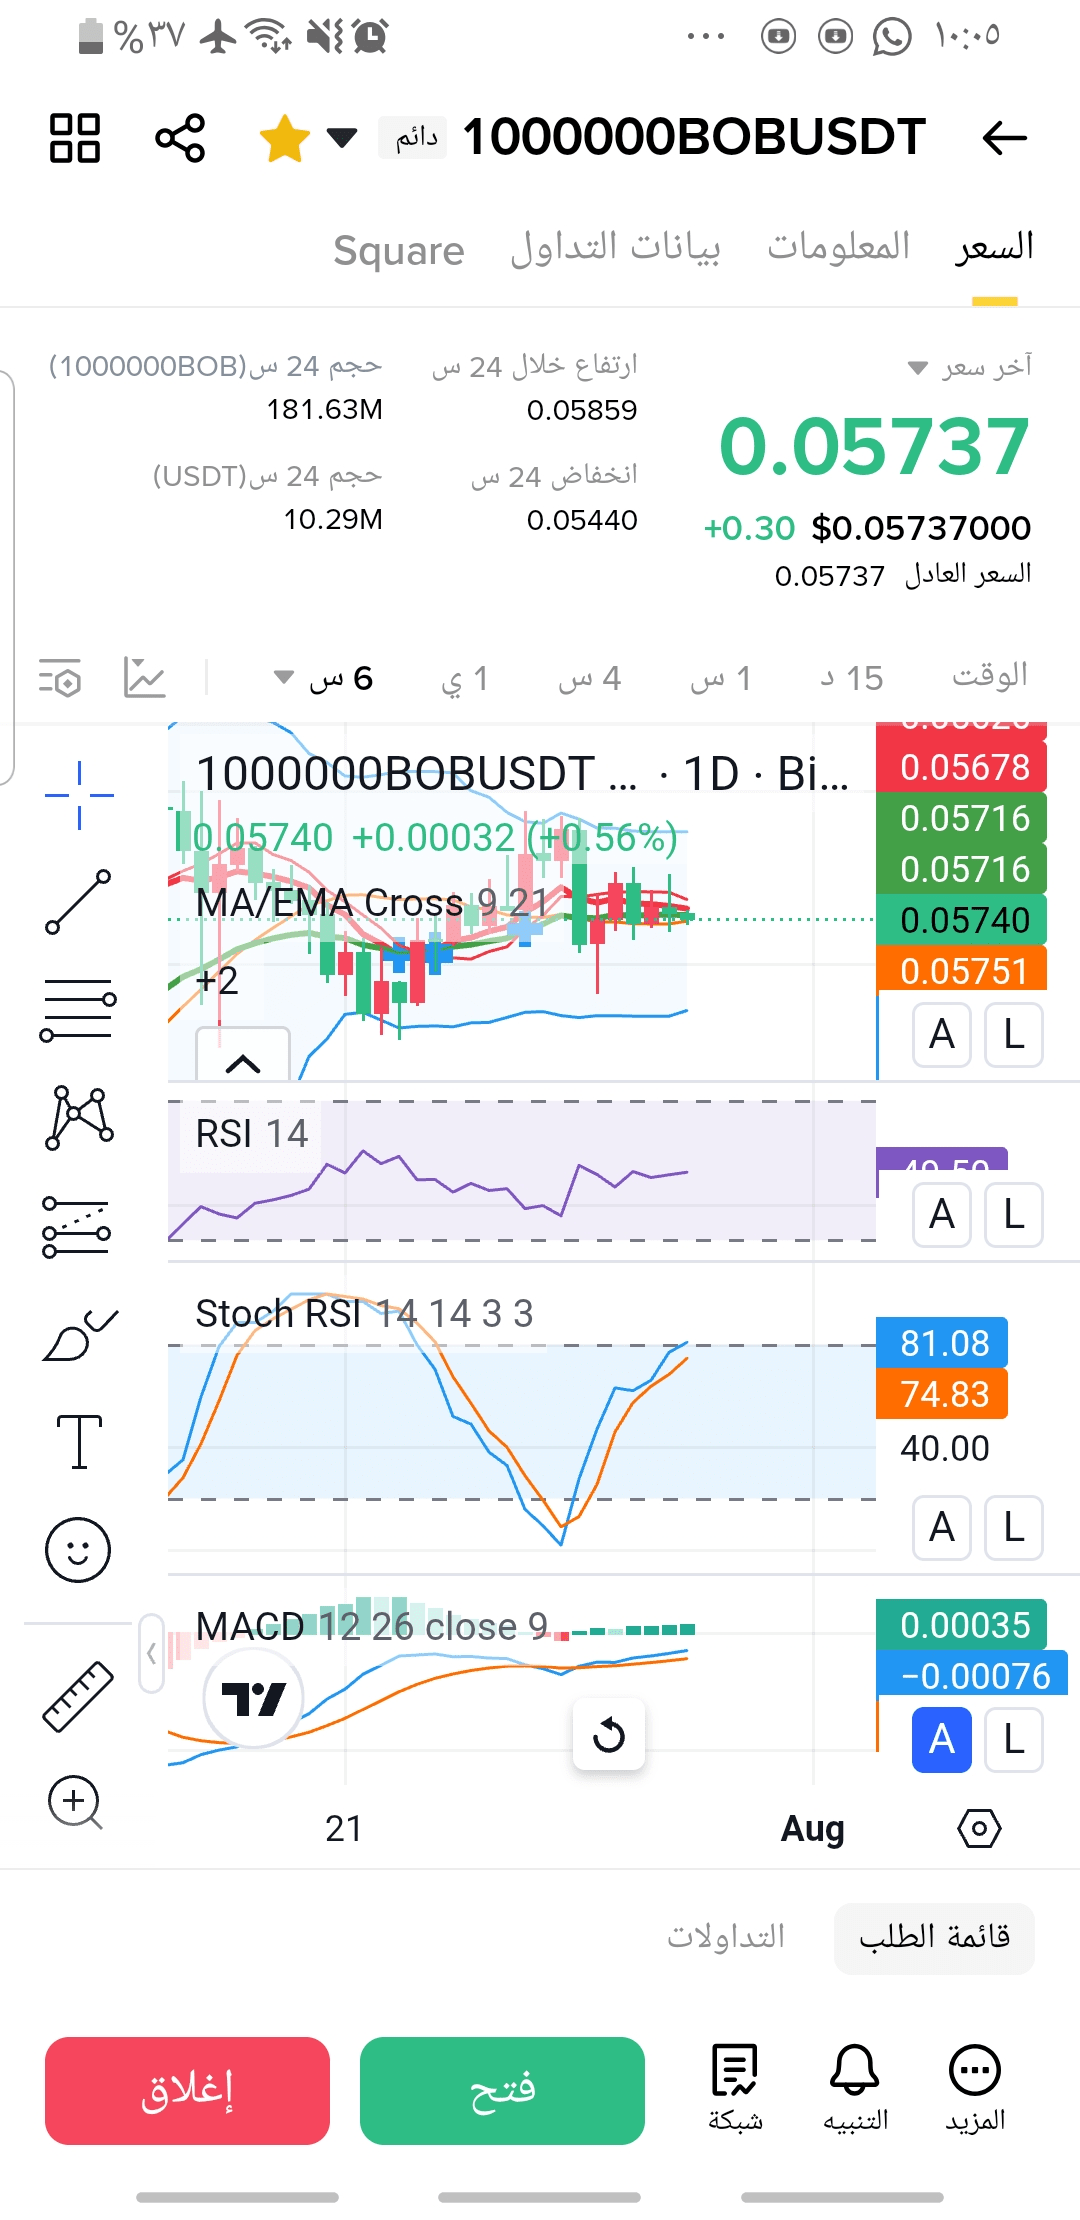
Price: 0.05737 USDT
A slight positive change of +0.56%, indicating a temporary consolidation in the movement.
---
2. Moving Averages (MA/EMA 9 and 21):
The price appears to be moving around the averages and not clearly above them.
This indicates a state of volatility and lack of confirmation of a clear trend (no strong uptrend and no clear downtrend currently).
A real breakout to the upside or downside will indicate the trend.
---
3. Relative Strength Index (RSI) (14):
Value: Approximately 50
This indicates that the market is neither overbought nor oversold.
Neutral zone → The market is waiting for a new catalyst.
---
4. Stochastic RSI:
%K = 81.08 and %D = 74.83
It has entered the overbought zone (>80), and a slight correction or decline may start in the short term if it does not break out strongly upwards.
---
5. MACD (12,26,9):
The blue line is approaching the intersection of the orange line from below (positive signal).
The histogram is weak green, indicating a weak uptrend or the beginning of an uptrend.
---
✅ Conclusion:
Current trend: Sideways with weak upward bias.
The price is consolidating above some averages but without a strong breakout.
There is no strong entry signal currently, but if:
The price broke the 0.05859 level (24-hour high) with strong trading volume,
It held above the averages (especially EMA21),
It can be considered an entry signal towards a new upward wave.
---
⚠️ Caution point:
If the 0.05440 level (24-hour low) is broken, it will be a short-term negative indicator.
---
🔔 Recommendation:
Watch carefully for now, and enter after a confirmed bullish breakout or bounce from clear support.
You can activate an alert when 0.0586 is breached or 0.0544 is broken.


