Good night, friends at Binance Square. 😍😍
I say 'good night' because it is now 2 AM where I am. Soon, we will welcome a new day with new hopes and happy hearts.
Let's think about a few questions:
What has Bitcoin done in the past? What is it doing now? What might it do in the future?
Of course, for the unregulated BTC, relying solely on technical analysis to interpret price trends is not always sufficient.
While the decentralized nature of BTC seems like a good thing, past and present have proven that it is often influenced by global forces and events, and it is likely to continue in the future.
The biggest advantage of BTC being unregulated is: high price volatility.
This attracts a large number of high-risk tolerant investors while deterring more traditional, centralized individuals and institutions.
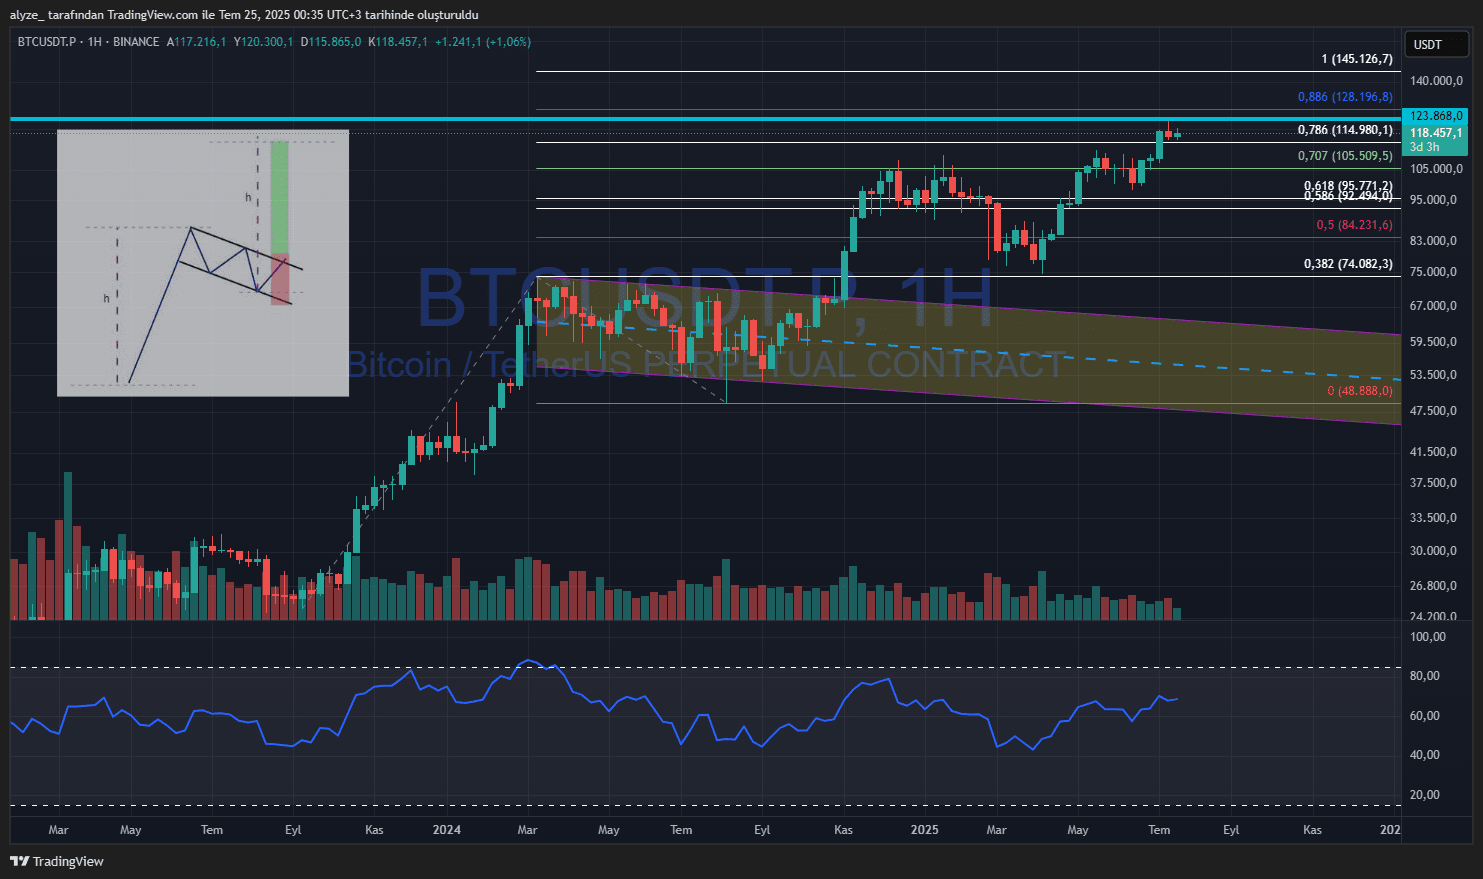
Currently
BTC's price fluctuates between $117,000 and $120,000.
The first key resistance level is $121,556, which I mentioned earlier.
If the price cannot close above this position for several consecutive days, testing $100,000 is still a high probability event.
The current main support level is
$116,862.
If a daily close occurs below this level, it could trigger a deeper round of declines.
The level of $123,868 that I marked with a bold line on the chart, if it really needs to drop, may first be 'pierced' to reach.
I will explain the importance of this price level in detail in the upcoming posts.
"Without understanding yesterday, one cannot guide today and tomorrow!...
For this BTC technical analysis, we will base it on data starting from 2012. In the previous post, we mentioned the price of $123,868, and here we will delve into its meaning.
When prices experience unexpected turbulence, we usually look for reasons, often attributing it to news or government decisions, falling into the cliché of 'it’s because of this, otherwise I would have known earlier.' However, what actually drives the market, especially the prices of major commodities, are AI and trading bots in exchanges.
If a commodity is technically destined to reach a certain price, there are two scenarios: either investors smoothly drive the price to the target based on technical analysis (soft landing or soft takeoff), or if investor pressure or appetite dominates, AI bots will intervene to push the price to where it should go – usually triggered by news, rumors, or events. With the push of a button, the price fluctuates rapidly, often accompanied by pain and loss. But regardless, the price will eventually reach its rightful position.
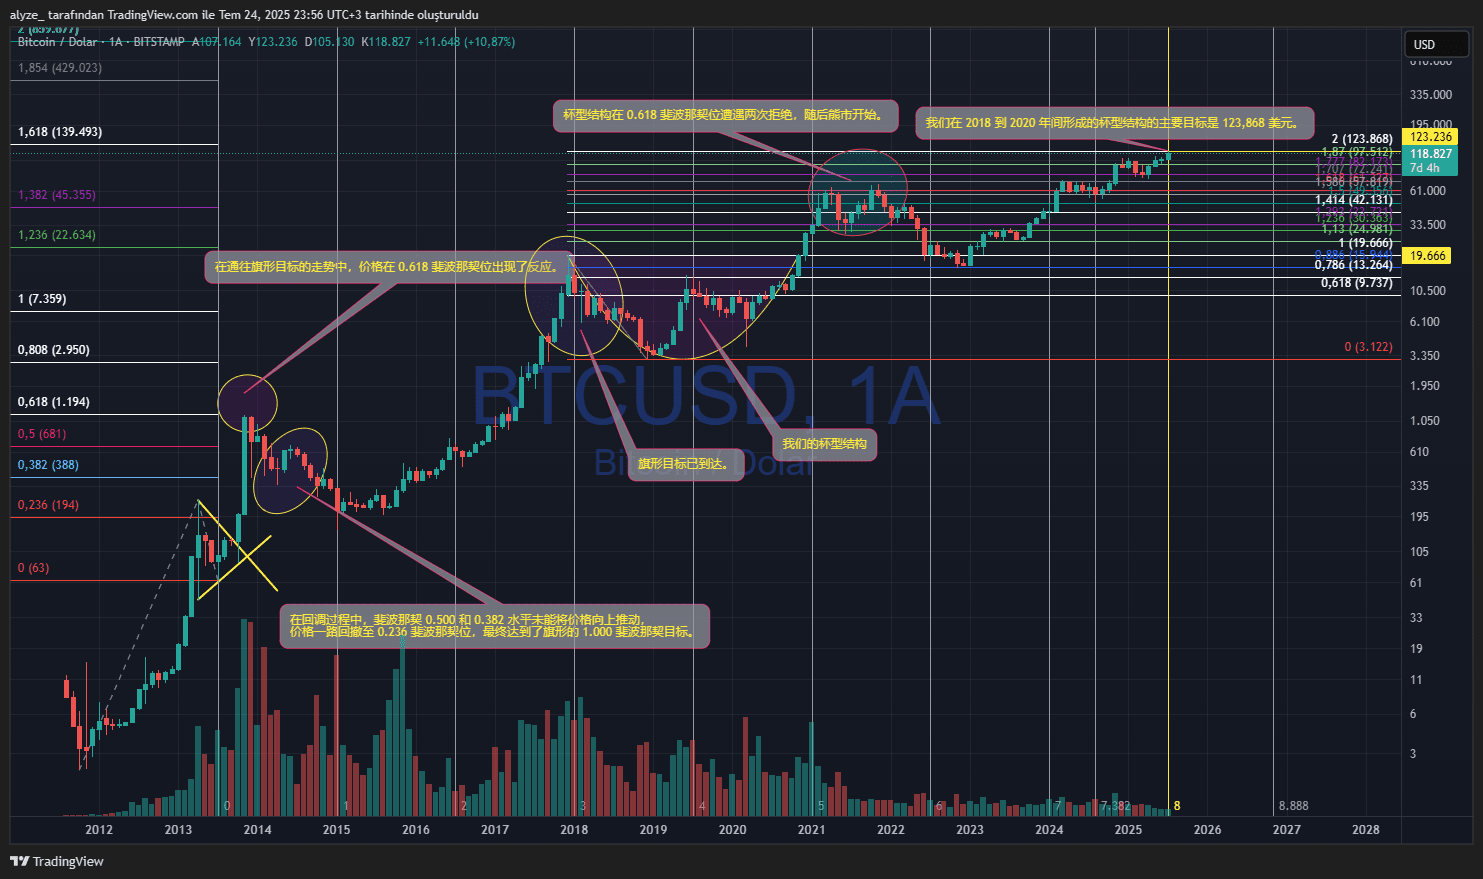
We can see that the flag pattern formed in 2012 reached its target in 2018, then dropped; the cup structure formed in 2020 reacted at Fibonacci 0.618; then the rising wedge caused a bear market decline.
The key question now is whether the cup structure formed between 2018 and 2020 will reach its target of $123,868. It is likely that after hitting this price level, there will be a wick and a test of $100,000 – the next steps will be discussed in the next post.
By the way, the trend is based on the 8th level of Fibonacci extension, which coincidentally corresponds to the cup structure target and historical peak, seemingly related to Binance's 8th anniversary.@币安Binance华语 @Binance Square Official 🤩😊
After all, the market is 'consulting' Binance. 'Even though we knew little about crypto at the time, joining the Binance community 7.3 years ago was no coincidence. We may not have known much, but we did understand some things.'
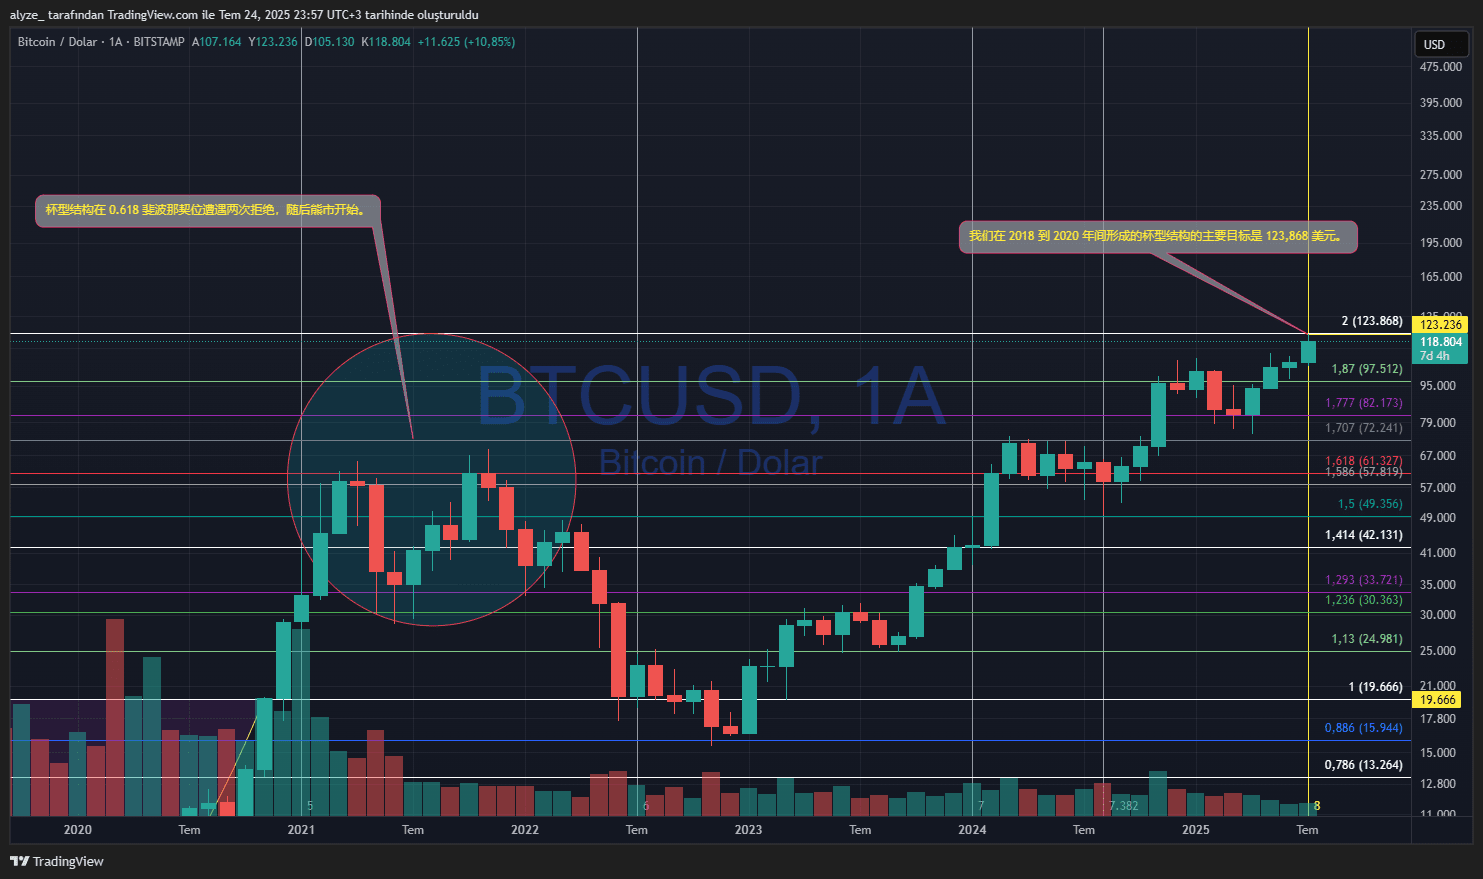
Where will BTC stop? What will the next trend look like?
Starting from $25,000, BTC rose to $74,000, forming a flag structure, and then experienced a 'false breakout' wick down to $48,888 (this '8.888' is not a coincidence; the market structure conveys a strong energy signal).
From that moment on, Bitcoin embarked on a journey towards $145,126. The key resistance we first face is: the target of the cup structure formed in 2020. It will either break through with strong volume and continue to target, or be rejected here and retest the liquidity area around $100,000.

So, what will BTC do next?
The cup and handle formation from 2021 to 2024 has a theoretical target of $267,722, but I do not think this price level will be reached in the current cycle.
It is more likely that we will encounter strong resistance at $155,255, which is the Fibonacci 1.618 level – just as has happened many times in past cycles.
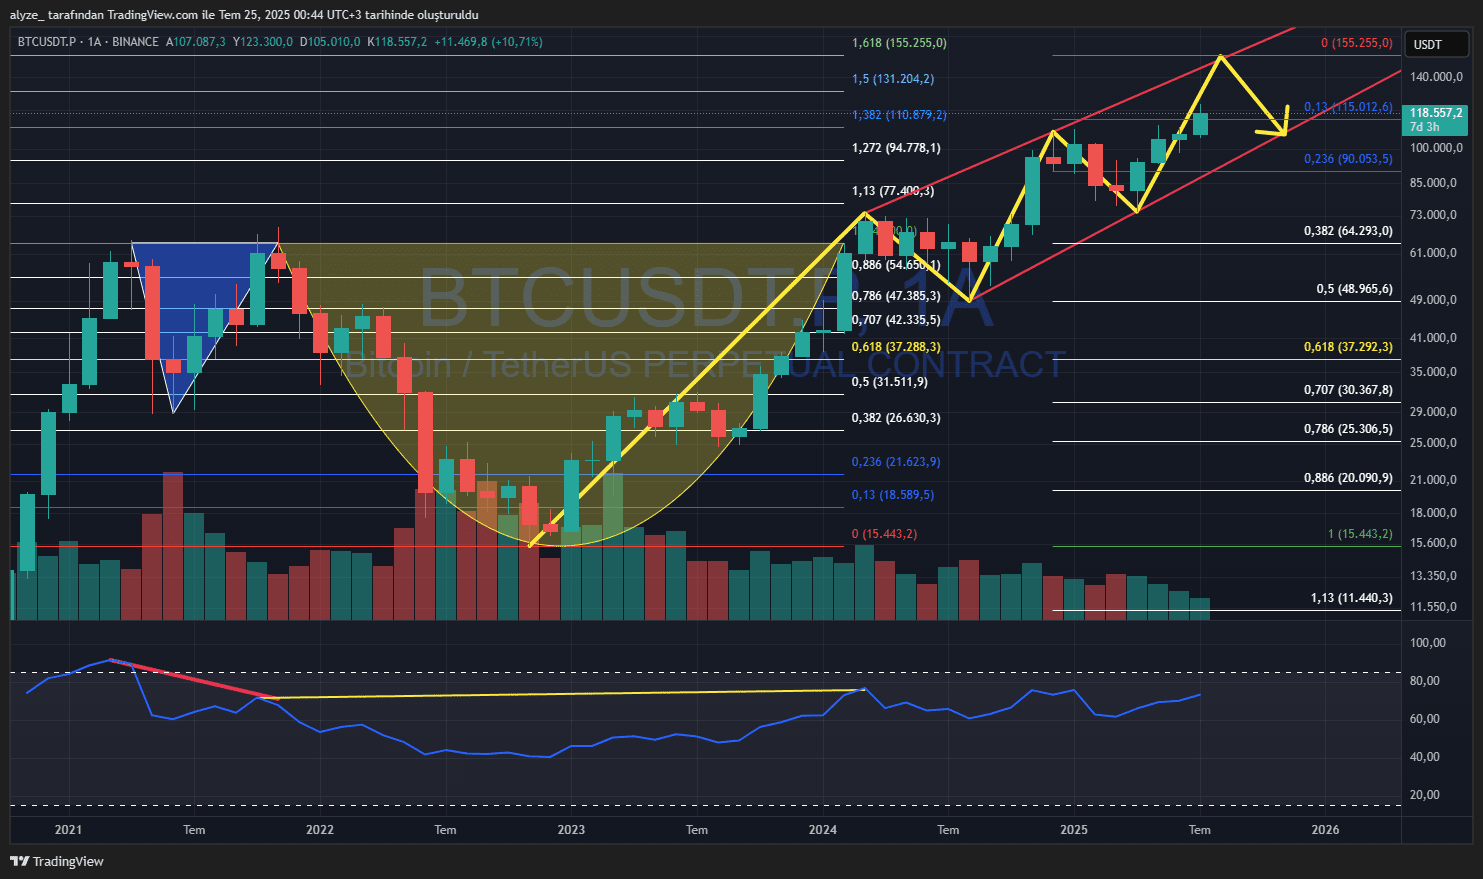
Looking again at the current price structure on the right, we can also see a rising wedge forming – this may also complete around $155,000.
After that, a pullback may occur, targeting sequentially: $64,293, $48,965, and $37,292.
But the key point is: the price does not necessarily have to drop to the bottom. As long as the pullback can reach any Fibonacci key level (0.382, 0.500, 0.618) and form a rebound, then from a technical perspective, the structure is complete.
Remember: this is just my personal prediction. Whether it comes true, we will wait and see. But these price ranges might be worth remembering.
If you read through these three posts seriously from start to finish, that’s great;
If you read them without fatigue, I am even more grateful.
Take care, friends.


