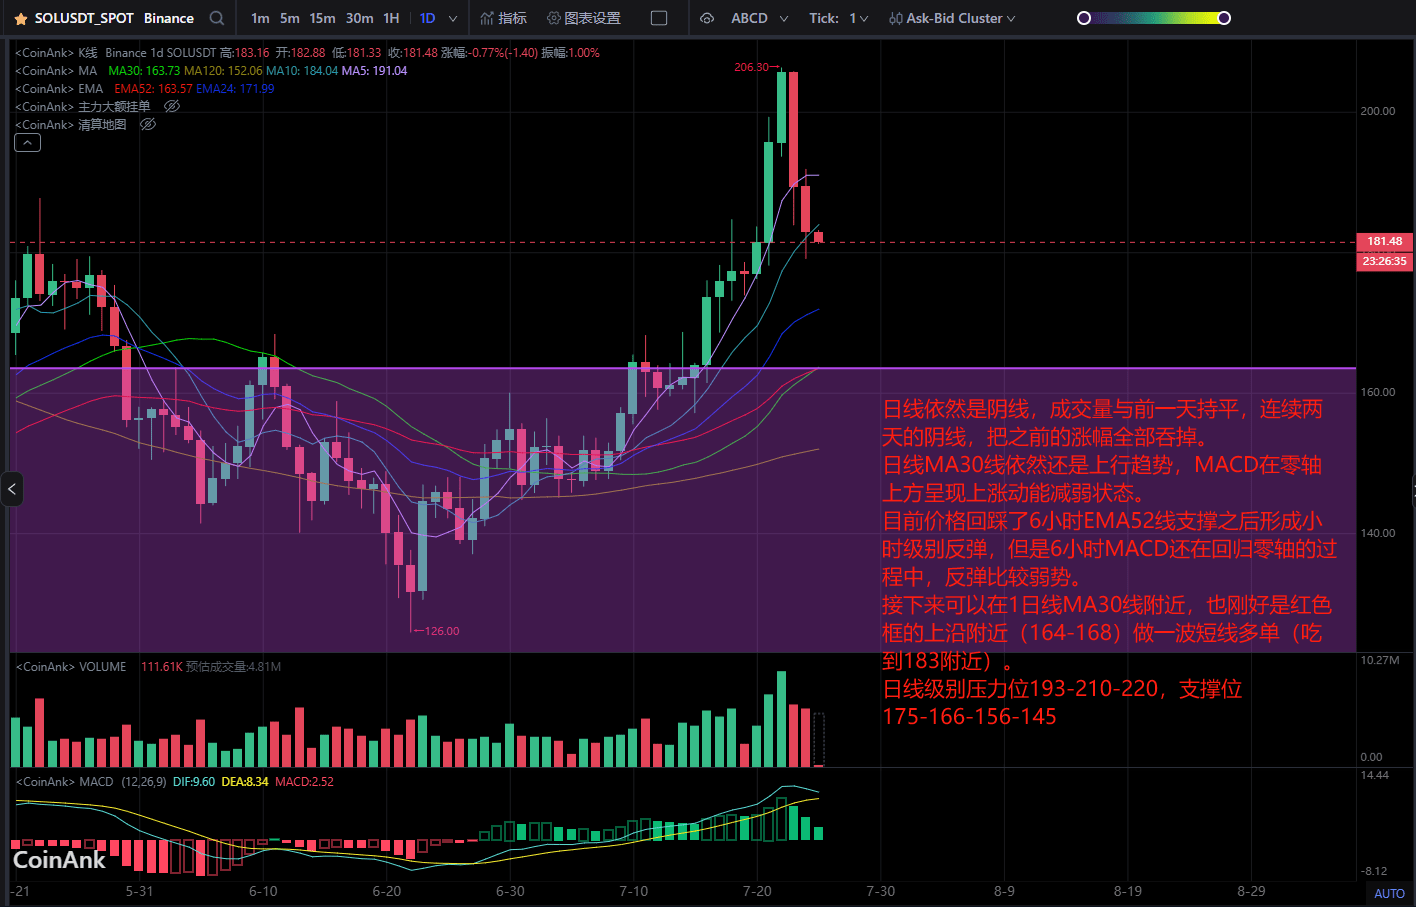
The daily chart still shows a bearish candle, with trading volume remaining the same as the previous day. Two consecutive bearish candles have completely engulfed the previous gains.
The daily MA30 line is still in an upward trend, but the MACD shows weakening upward momentum above the zero axis.
Currently, the price has bounced back from the support of the 6-hour EMA52 line, but the 6-hour MACD is still in the process of returning to the zero axis, indicating a weak rebound.
Next, a short-term long position can be taken near the MA30 line on the daily chart, which is also near the upper edge of the red box (164-168), aiming for a target around 183.
Daily chart resistance levels are 193-210-220, while support levels are 175-166-156-145.