Implied Volatility (IV)
This term is one of the key terms in the options market and means expected volatility. The higher it is, the more expensive the options.
For the crypto market, the IV of American indices is a useful indicator, especially in phases of a pronounced trend. The pattern is as follows:
➡️ Low IV for SPY (ETF on S&P 500) in a bullish market most often implies the continuation of the upward movement of crypto quotes. The logic is simple — when the volatility of reliable instruments decreases, capital is more willing to buy high-risk assets. When IV increases, the probability of a reversal (end of the bull market) also increases.
▫️ The classic bullish market operates under the following laws:
➡️ It rises $BTC , then rises $ETH , then the other altcoins. For the cycle to work and not 'break' halfway, the IV on SPY must remain low throughout its duration. This is the main idea of the article.
▫️ As for the cycle itself, in practice, there are often some 'outsiders' that grow along with ETH or even earlier. For example, in the two alt seasons of 2024, it was $SOL , and in the summer of 2025 — XRP.
▫️ The phase of altcoin growth follows the principle of sequence, where profit fixed in one token moves to another token. From the sequence, one can conclude about the potential of a particular asset. For example, right now SOL is pumping last (when TOTAL3 is already close to ATH), which confirms the conclusions about the weakness of the token against the backdrop of other giants. This means that money may not reach SOL within the cycle if it breaks off, not completing the full stage (IV on SPY spikes). That is why Solana is considered a candidate for shorting, despite some readers already attributing losses to the admin in this 'short' (as they say — keep us updated).
➡️ If there is no correction after a short-term cycle (i.e., IV does not start to rise), the cycle repeats — pump BTC, then ETH, then other alts. In this case, the period after the pump of the first cycle on the chart becomes a 'bullish flag'. By the way, the fall in BTC dominance with low IV for SPY is also a bullish flag in Bitcoin when the profit fixed there goes to pump alts (if you want to understand the fundamental reason for the operation of the TA figure).
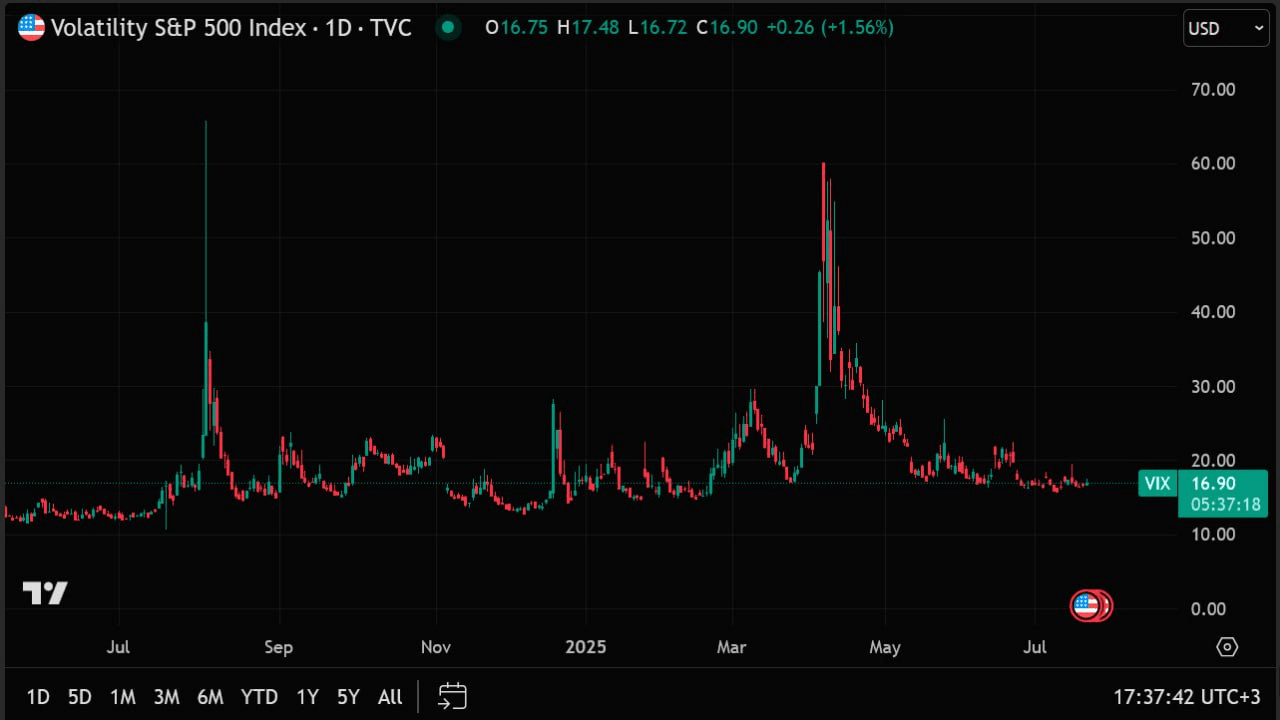
✔️ The indicator reflecting IV for the entire market is the VIX index (also known as the 'fear index'). We have written a separate article about it. Since the end of June, the VIX has been at low values, which aligns well with the alt season. This 'window of opportunity' remains open. Investors are not afraid at all, having confidently gone through the entire cycle and are already trying to make a second round — money is once again flowing into BTC, after which it will go back to ETH and altcoins if the IV for SPY does not rise.
✔️ The nearest obvious candidate for a VIX increase is the Fed's meeting on July 30. At the moment, investors are so calm that they have even stopped paying attention to the news about the trade war. Therefore, for example, the quotes hardly reacted to yesterday's escalation on the US-EU front. Everyone is confident that in the end, the situation will resolve without significant damage to the stock market.
➡️ We do not account for black swans — they can appear at any moment by default and spike the VIX.
➡️ IV indicators are available in many terminals. However, for simplicity, one can not worry at all and just look at the VIX, as it reflects the volatility of the S&P 500, which is needed in the context of crypto.
P.S. It is worth clarifying that IV stands for Implied Volatility, not the Roman numeral 4.