Position management gives everyone current suggestions:
1. For example, if you take out 30,000 U for contracts, my suggestion is to divide it into three parts, each part being 10,000 U.
2. Open a position with 1 part each time, a fixed 10,000 U, with Bitcoin not exceeding 10 times leverage and altcoins not exceeding 5 times.
3. If you lose money, for example, if you lose 1,000 U, you should replenish 1,000 U from outside. If you earn 1,000 U, take out 1,000 U.
4. Ensure that in the recent period, you can guarantee each time you open a position, you maintain a fixed position of 10,000 U.
5. Until you earn 60,000 U through this method with your initial 30,000 U, raise each of your positions to 20,000 U.
The benefit is: the first point, split positions + low leverage, avoiding losses of all funds due to exchange spikes.
Point 2, avoid questions like this from happening to you. If you get too invested one day and lose everything, the maximum loss should be 1/3, and the remaining can give you a buffer opportunity.
Point 3, maintain a fixed position. You can keep a relatively calm mindset whether you are at a loss or a profit, which can help stabilize your mindset.
The martial arts secrets have been given to you; whether you can make a name for yourself in the world depends on you.
In the crypto market, if you want to turn 10,000 into 12 million, there is only one way: rolling positions + investing in big altcoins!
The most aggressive methods should also be divided into three times. This means you should at least give yourself three chances.
For example, if the total account balance is 200,000, and the maximum loss allowed is 20%, which is 40,000, then the most aggressive loss scheme I suggest is: 10,000 for the first time, 10,000 for the second time, and 20,000 for the third time. I believe this loss scheme still has a certain level of rationality. Because if you get it right once out of three, you can profit or at least continue to survive in the market. Not being kicked out of the market is itself a kind of success, and there is a chance to win.
2. Grasp the overall market trend. Trends are much harder to navigate than oscillations, as trends involve chasing highs and cutting losses, requiring strong resolve to hold positions, while buying low and selling high aligns more with human nature. Trading opportunities that align with human nature often yield no profits; it is precisely because they are difficult that they can be profitable. In an upward trend, every aggressive pullback should be seen as a buying opportunity. Do you remember what I said about probabilities? So, if you haven't boarded the train, or if you’ve exited, wait patiently for a 10-20% drop and boldly go long.
3. Set stop-loss and take-profit targets. Stop-loss and take-profit can be said to be the key to whether we can make a profit. In several transactions, we must ensure that total profits exceed total losses. Achieving this is not difficult; just adhere to the following points: ① Each stop-loss ≤ 5% of total funds; ② Each profit > 5% of total funds; ③ Total trading win rate > 50%. If the above requirements are met (with a profit-loss ratio greater than 1 and a win rate greater than 50%), profit can be realized. Of course, you can have a high profit-loss ratio with a low win rate or a low profit-loss ratio with a high win rate. Anyway, as long as you ensure total profits are positive, total profit = initial capital × (average profit × win rate - average loss × loss rate).
4. Remember that excessive trading can lead to losses. Since Bitcoin perpetual contracts trade 24/7, many novices trade nearly every day during the 22 trading days a month. As the saying goes: 'If you walk by the river often, how can you avoid getting wet?' The more you trade, the more likely you are to make mistakes. After making a mistake, your mindset can deteriorate, leading to emotional decision-making and 'revenge' trading: possibly against the trend or heavily leveraged. This can lead to a series of mistakes, resulting in significant losses that may take years to recover.
A few points to note about rolling positions:
1. Enough patience; the profits from rolling positions can be massive. As long as you can roll successfully a few times, you can earn at least over a million, so you cannot roll easily; you must find high certainty opportunities.
2. High certainty opportunities refer to a situation where there is a sideways consolidation after a sharp drop, followed by an upward breakout. At this time, the probability of following the trend is high, so you must find the point of trend reversal and get in right away.
3. Only roll long, do not short.

A guide to bottom-fishing and top-escaping in the crypto market, teaching you how to make big money from cycles using these five major indicators.
Today, I will mainly introduce how to use indicators to determine tops and bottoms and how to optimize investment strategies.
How to earn cyclical money and how to amplify your cyclical returns.
Two, five major indicators teach you how to determine tops and bottoms.
1. Ahr 999 Hoarding Indicator
Indicator Introduction: This indicator was created by Weibo user Ahr 999 to assist Bitcoin regular investment users in making investment decisions based on timing strategies. This indicator implies the yield rate of short-term Bitcoin regular investments and the deviation of Bitcoin price from expected valuation.
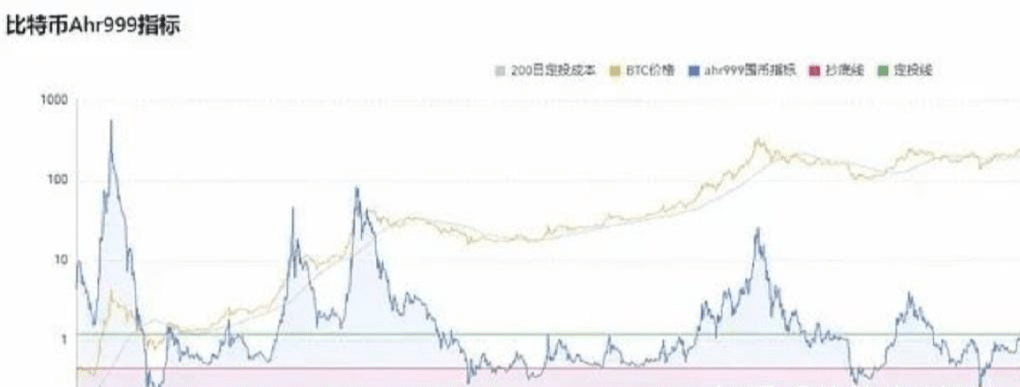
How to use:
When the Ahr 999 index < 0.45, it indicates a good buying opportunity.
When the Ahr 999 index is between 0.45 and 1.2, it is suitable for regular investments.
When the Ahr 999 index > 1.2, the coin price is relatively high and not suitable for regular investments.
Recommended reading by the indicator author (Hoard Bitcoin).
2. Rainbow Chart
Indicator Introduction: The rainbow chart is a long-term valuation tool for Bitcoin. It uses a logarithmic growth curve to predict Bitcoin's potential future price direction.
It covers the rainbow-colored band at the top of the logarithmic growth curve channel, attempting to highlight the market sentiment at each rainbow color stage as the price passes through it. Thus emphasizing potential buying and selling opportunities.
So far, the Bitcoin price continues to remain within the rainbow-colored band of the logarithmic growth channel.
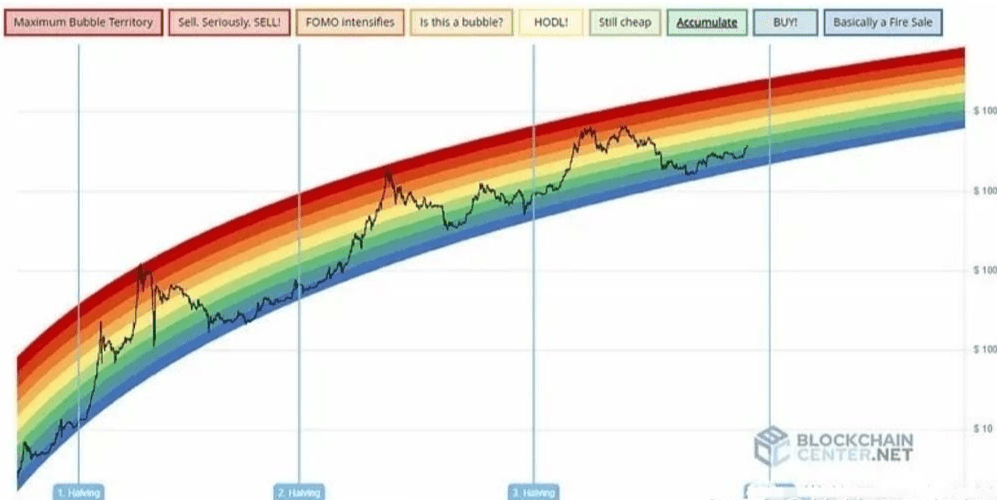
How to use:
The closer to blue, the closer the price is to the bottom.
The closer to red, the closer the price is to the top.
3. RSI
Indicator Introduction: RSI (Relative Strength Index) is an indicator that measures the speed and magnitude of Bitcoin price changes, calculating the RSI score based on the performance of the previous 12 months to determine the strength of market trends and whether it is in the overbought or oversold zone.
The stronger the upward momentum, the closer the RSI will be to 100, and a high RSI indicates a positive price movement over the past 12 months; conversely, the stronger the downward momentum, the closer the RSI will be to 0, indicating a relatively negative price movement.
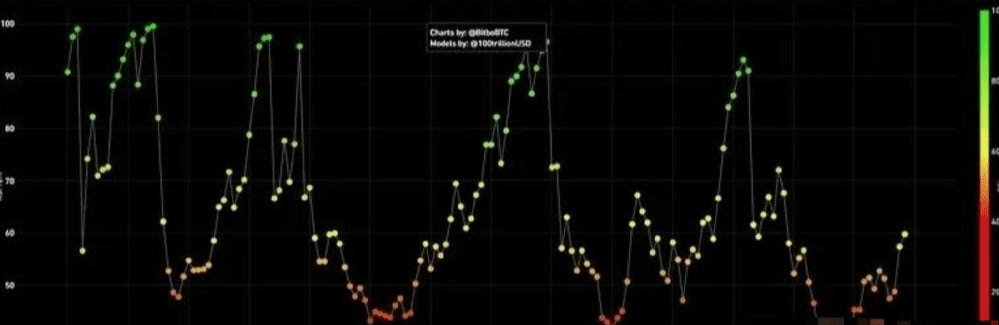
How to use:
An RSI value of 30 or below (the closer to red) indicates that Bitcoin has been oversold or may soon face overselling, making it suitable to consider bottom-fishing.
An RSI value of 70 or above (the closer to green) indicates that Bitcoin is overbought and may face a decline soon, making it suitable to consider selling.
4. 200-week Moving Average Heatmap
Indicator Introduction: This indicator uses a colored heatmap based on percentage growth relative to the 200-week moving average.
Assign a color to the price chart based on the monthly percentage growth of the 200-week moving average.
Historically, Bitcoin's price has bottomed near the 200-week moving average during each major market cycle.
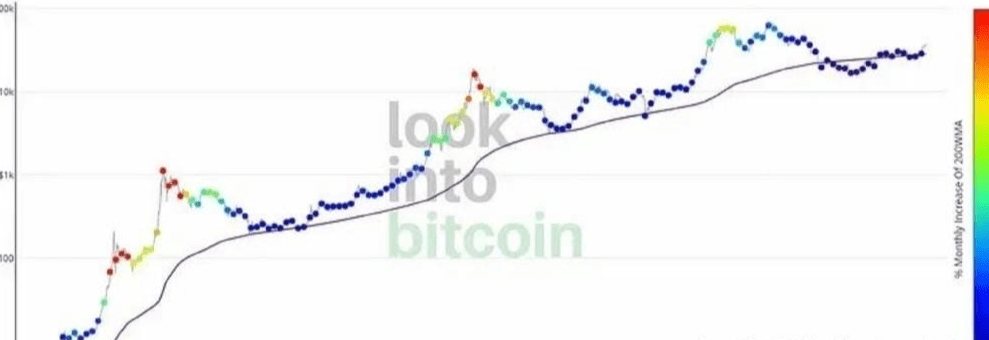
How to use:
The color of the dots on the price chart that are closer to red indicates that the market is overheated and suitable for selling.
The closer to purple, the colder the market, making it suitable for buying.
It should be noted that this indicator failed at the peak of the last bull market, which indicates that we cannot rely solely on indicators. Indicators are merely tools to assist our judgment, and we also need to consider many other factors.
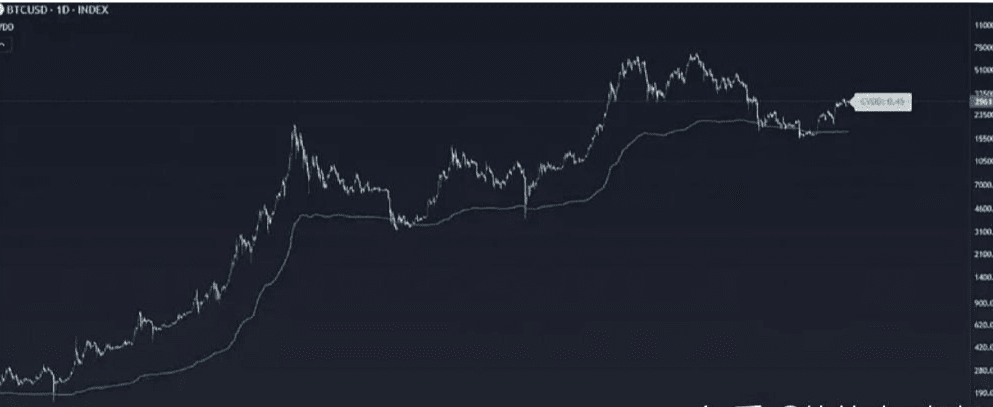
5. CVDD
Indicator Introduction: CVDD stands for Cumulative Value-days Destroyed.
How to use: When the Bitcoin price touches the green line, it indicates that Bitcoin is severely undervalued, making it a great buying opportunity.
Summary.
To facilitate readers' use of these indicators, we have turned them into charts.
It should be noted that these indicators provide references for buying and selling Bitcoin and do not necessarily mean that other tokens can also be bought.
Three, strategies suitable for cyclical trading.
When we engage in long-term trading, it is easy to encounter situations like the one shown below, often due to subjective judgment errors. If we had prepared a strategy in advance, we could have avoided such errors.

1. Combine the Martingale theory with regular investments.
Let's first understand the concepts of the 'Martingale strategy' and 'regular investment.'
Martingale Strategy: The Martingale strategy was originally a gambling strategy that involves increasing the bet amount by a factor of 2 every time you lose until you win.
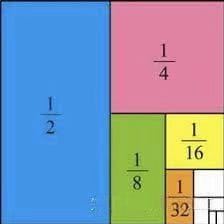
Assuming a fair betting game, both high and low have a 50% chance. Thus, at any given point, the probability of losing once is 50%, the probability of losing twice in a row is 25%, and the probability of losing three times in a row is 12.5%, and so on.
And so on. The more times you play, the lower the probability of losing. Theoretically, with infinite funds, you cannot lose.
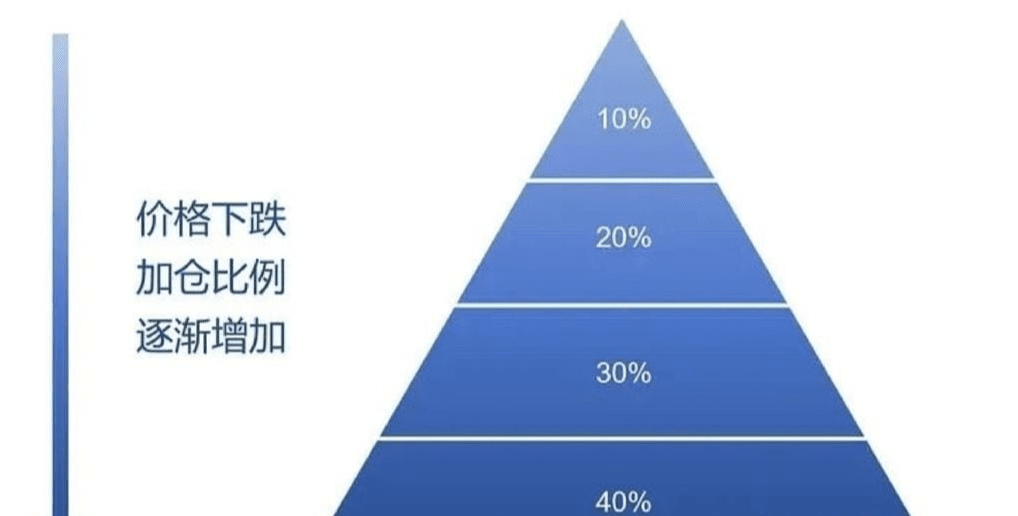
Later, the Martingale strategy was applied to trading, manifested in pyramid-style position increases (the Martingale strategy can be subdivided into reverse Martingale, forward Martingale, and scalp Martingale; the one we are introducing here is reverse Martingale).
Regular investment: Regular investment is a long-term investment strategy that averages the purchase price by regularly purchasing assets as planned. This strategy emphasizes continuous investment and long-term holding rather than attempting to profit from short-term market fluctuations.
When using the above indicators, they cannot tell us the exact points for bottom-fishing and top-escaping; they can only determine the relative bottoms and tops within a cycle. Moreover, we cannot always keep an eye on indicators, which is why we need to carry out regular investments.
How to formulate strategies: We can apply the Martingale strategy to regular investments to minimize our average holding cost. The specific strategy can be formulated as follows: Assuming the current Bitcoin price is $37,000, begin regular investments from this price. Based on the above indicators, it can be judged that the current Bitcoin price is at a moderate level and suitable for regular investments.
We set the benchmark amount for regular investments at 1,000 yuan, with a frequency of once a week. In each weekly investment, if the price rises by $1,000, the amount of our regular investment decreases by 5%. If the price falls by $1,000, the amount of our regular investment increases by 5%, provided that the indicators indicate that the Bitcoin price is still within the investment range.
When Bitcoin rises beyond this range, pause the regular investment plan. Once it returns to the investment range, continue regular investments or monitor indicators to reduce positions. These strategy parameters are just examples; different strategy parameters will naturally yield different returns. Readers can formulate their own regular investment strategies based on this process.
Disadvantages: The Martingale strategy claims to 'never lose money,' but this is based on the premise that the trading target does not go to zero and that the trader has unlimited funds. Therefore, the Martingale strategy is not suitable for trading long-tail assets; the larger the trader's capital, the more the advantages of the Martingale strategy can be reflected.
2. How to use grid strategies to expand profits.
When we conduct long-term investments, holding Bitcoin spot in decentralized lending platforms yields a low APY; however, depositing in exchange financial products offers decent APY but comes with limits. To improve fund utilization and earn extra returns, using spot grids is a good choice.
Spot grid strategy: The spot grid strategy is an automated strategy that executes low buying and high selling within a specific price range. Users only need to set the highest and lowest prices of the range and determine the number of grids to begin running the strategy.
If needed, you can also set trigger conditions in advance, and when the market conditions meet the trigger conditions, the strategy will automatically begin to run. The strategy will calculate the buy low and sell high prices for each small grid, automatically placing orders and continuously capturing opportunities for profit as the market fluctuates.
How to formulate strategies: Generally speaking, the grid strategy is suitable for oscillating markets or oscillating upward trends; it is not suitable for one-sided markets. The drawbacks of the grid strategy are obvious; when the price rises or falls outside the set range, it can lead to missed sales or heavy buying, which is why some call it a garbage strategy.
We optimized the grid strategy; we do not choose conventional non-stablecoin/stablecoin traditional grid strategies, but rather use the ETH/BTC trading pair in conjunction with the infinite grid strategy.
The infinite grid strategy is an advanced version of the ordinary grid strategy. In a rising market, the infinite grid ensures that users hold an equivalent amount of priced currency assets. Using the infinite grid strategy, no matter how many times a user sells, they will still have assets equivalent to the previous position.
For example, if the initial price is 20,000 USDT/BTC, and the user owns 1 BTC, they have 20,000 USDT in assets for investment. When the price rises to 40,000 USDT/BTC, selling half yields 10,000 USDT, and the user still has half a unit, retaining 20,000 USDT in assets for investment. When the price rises to 80,000 USDT/BTC, selling another quarter leaves the user with a quarter unit, still maintaining 20,000 USDT in assets for investment.
The infinite grid does not have a definitive top range, so using the infinite grid strategy can effectively avoid the situation of missing out on sales due to continuous price increases.
So why choose the ETH/BTC trading pair? Our optimization idea for the grid strategy is to avoid losses caused by prices exceeding the grid range, but due to the characteristics of the grid strategy itself, we cannot solve losses caused by continuous price declines; we can only reduce losses caused by declines.
ETH/BTC reflects the relative strength of movements between ETH and BTC. From a cyclical perspective, the ETH/BTC exchange rate trends upward during bull markets and trends downward during bear markets. The ETH/BTC trading pair is well-suited for the infinite grid strategy, which is appropriate for long-term slow bull markets.
Moreover, we can not only obtain returns in BTC but also benefit from the bull market rises of ETH and BTC.
Four, conclusion.
Although the indicators and profit methods discussed in this article are based on Bitcoin as the investment target, readers can also apply the bottom-fishing and top-escaping ideas from this article to invest in other cryptocurrencies. Moreover, the price changes of Bitcoin also provide guidance for the trends of other cryptocurrencies, especially leading mainstream coins.
No matter what the indicator is, it has its inherent invariance. Although black swan events often occur in the market, the crypto market will not go to zero. As long as it doesn't go to zero and there are participants, the price will always fluctuate, existing in cycles. This is not only an estimation of value but also a test of time.
For ordinary investors, as long as you take advantage of the cycle and enjoy the dividends of industry development, you are good. This is not only true in the crypto market, but in other industries as well. The multiplier is not important; the most important thing is to be able to sustain participation. What the crypto market lacks is not opportunities but the ability to continue participating.
So, what elements are needed to become a trading expert? I believe there are three key elements:
The first element is to be objective and neutral towards others' opinions and market news, without any thoughts. Maintain objectivity and neutrality without generating any emotions. Act according to the rules; if there is no market opportunity, read books or drink tea. When there is a market opportunity, pay close attention and be ready at all times.
The second element, plan your trades. There is a saying: plan your trade, trade your plan. Based on our strategic methods, prepare a trading plan. When the opportunity truly arises, trade according to our plan. After preparing the trading plan, we need to wait patiently for the final confirmation signal. When there is no trading plan, wait patiently for the plan to appear. Once the confirmation signal appears, act decisively, and after opening a position, wait patiently for it to be stopped out or reach the take profit position.
Point three, no strategy will be 100% effective. When we open a position, we must be prepared for the worst. You can have expectations for the outcome of this trade, but don't set your expectations too high. When expectations are not high, if the market turns bad, it won’t cause too much pain. Conversely, if the market runs smoothly and the results are great, exceeding expectations will bring a little joy. Trading in the end is like this: no great sadness, no great joy; face trading calmly, with a peaceful and serene heart. If you make money and are overjoyed, telling everyone, or if you lose money and feel gloomy or regretful, losing control of your emotions, it shows you still have a long way to go on the trading front.
There are several short-term trading methods for trading cryptocurrencies:
1. Technical analysis: Use chart analysis, trend analysis, and other technical indicators to evaluate price trends, including support and resistance levels, moving averages, etc., to identify buying and selling opportunities.
2. News-driven: Pay attention to news and events in the market, analyze and predict their impact on the cryptocurrency market, and make quick buy or sell decisions.
3. Day trading: Profiting by capturing short-term price fluctuations, typically completed within a day.
4. Breakout trading: Observe the changes in trading volume when the price breaks through resistance or support levels to determine the market direction and buy or sell at the right time.
5. Swing trading: Take advantage of the significant price fluctuations to conduct medium to short-term buying and selling operations.
However, the cryptocurrency trading market is high-risk and operates over a short time frame, requiring investors to have a high risk tolerance and familiarity with market conditions. Additionally, short-term operations need to focus on risk control and reasonable stop-loss and profit targets to protect the principal and achieve good returns.
The crypto market is like a marathon; it's better to run steadily than quickly. Those who earn money by luck often lose it back through skill. Only by ingraining position management into your DNA can you survive in this cutthroat market. Remember: staying alive gives you the opportunity to turn things around.
When the market starts, profits double! Follow Cheng Ge and go with the trend, and wealth will naturally come.
Keep an eye on: SPK, C


