Exchange: Binance
Pair: GRT/USDT Perpetual Contract
Timeframe: 1 Hour
Current Price: $0.11293
🔹 Chart Tool: TradingView
🔍 Overview:
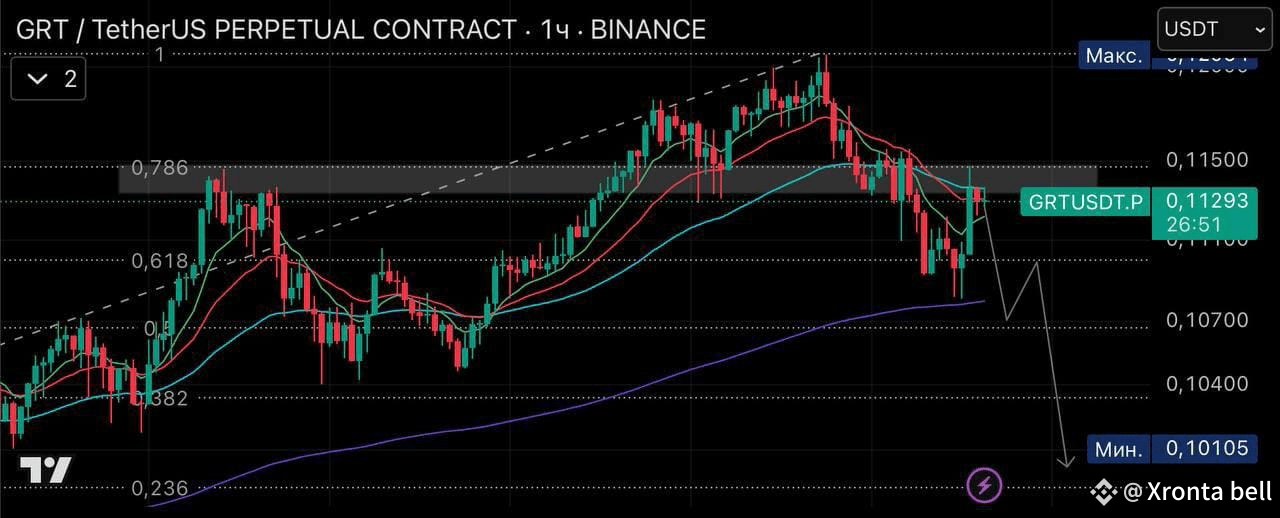
The 1-hour chart for GRT/USDT suggests a bearish bias forming after a failed breakout attempt at the 0.786 Fibonacci retracement level. Price action is struggling to break above a critical resistance zone, and recent candles indicate a rejection, potentially confirming a bearish reversal pattern.
📉 Bearish Signs to Note:
Fibonacci Rejection at 0.786:
Price attempted to break above the 0.786 Fib level (~$0.11500) but faced strong resistance. The shaded area highlights a supply zone where sellers are dominating.
The short-term EMAs (red and green lines) are sloping downward, suggesting increasing bearish momentum.
Price is trading below the 200 EMA (blue line), which often signifies a broader bearish trend on the intraday timeframe.
Bearish Structure Forecast (Drawn on Chart):
The projected path shows a potential minor bounce followed by a deeper correction, targeting:Support at ~$0.10700
Extended target: $0.10105 (marked as “Min.”)
This aligns with a full retracement back to the 0.236 Fibonacci level, acting as the next significant support.
📈 Key Levels to Watch:
Resistance Zone: $0.11400 – $0.11500
Short-Term Support: $0.10700
Major Support: $0.10105
Immediate Resistance: 0.11293 (Current Price)
⚠️ Trading Outlook:
Unless GRT/USDT breaks and holds above the 0.786 Fib level, the momentum remains bearish. A rejection at this level favors short setups, with eyes on the support levels outlined above.
🧠 Tip for Traders:
Watch for confirmation candles around the resistance zone and monitor volume. If sellers maintain control, shorting rallies could be a strategic approach in the short term.
💬 What's your take on this GRT setup? Share your thoughts below! 👇
#GRT #CryptoTrading #TechnicalAnalysis #ChartPatterns
$$BTC