🔍 Quick technical analysis of TRX/USDT (15 minutes)
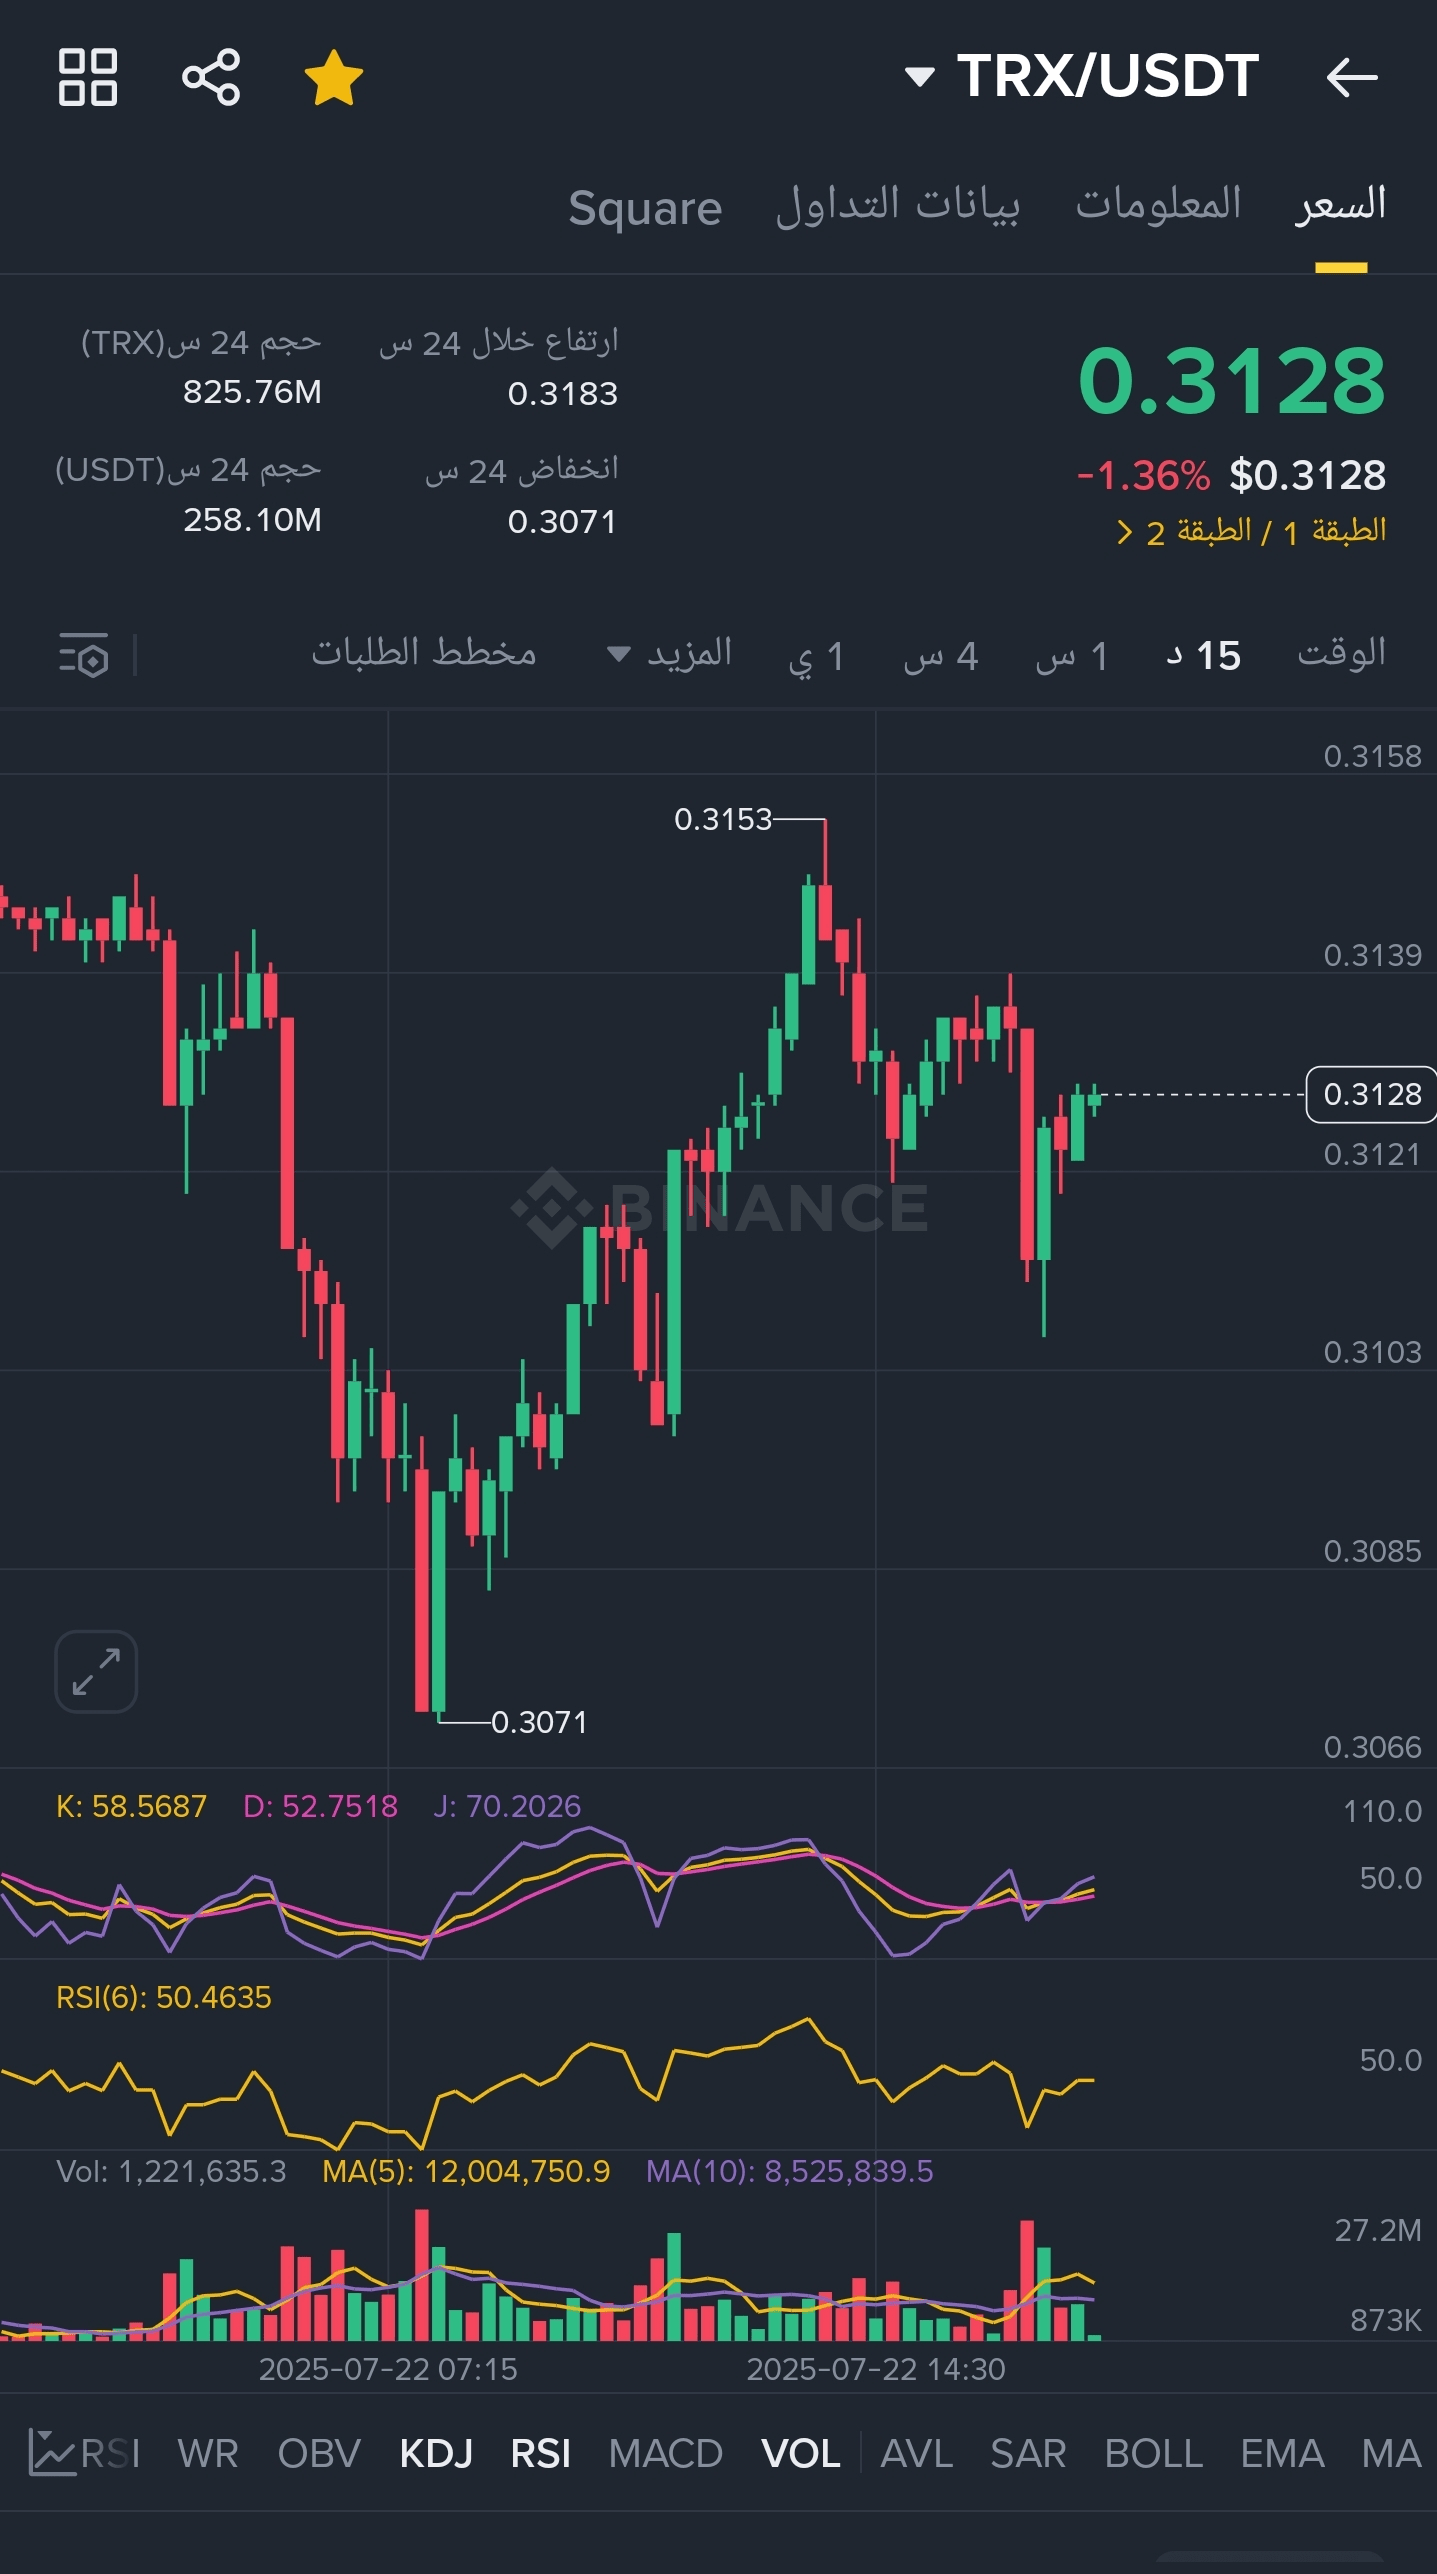
Current price: 0.3128
Percentage change: -1.36%
Highest/Lowest price in the last 24 hours:
Highest: 0.3183
Lowest: 0.3071
✅ Important technical levels:
Near resistance: 0.3153 – which is the recent peak that the price failed to surpass.
Immediate support: 0.3103 then 0.3071 – a zone from which the price has previously bounced.
📊 Technical indicators:
RSI (Relative Strength Index): at 50.46 – in the neutral zone, currently not indicating clear buying or selling strength.
KDJ:
K: 58.5
D: 52.7
J: 70.2
↳ Previous bullish crossover but in the overbought zone, we may see a slight correction.
Trading volumes (VOL): Relatively high trading volume indicates interest in the current price, but there is no decisive strong momentum.
---
🔄 Potential scenarios:
1. Positive scenario (break of resistance):
If the price breaks 0.3153 firmly with strong trading volume, it may target 0.3180 then 0.3200.
2. Negative scenario (break of support):
Breaking 0.3103 will retest 0.3071. If this level is lost, we could see a drop towards 0.3040.
📌 Summary:
The pair is currently in a narrow fluctuation zone after a rapid upward movement. There is no strong entry signal currently, but monitoring is required at the levels of 0.3153 (for a breakout) or 0.3103 (for a breakdown).
> ⚠️ Alert: The market is still in a sideways range, and any entry decision requires confirmation from both price and volume together.