K-line interpretation practical guide: From single signals to combination patterns, understanding them can save you 3 years of detours
In the cryptocurrency space, K-lines are an essential skill. However, many people only look at K-lines for ups and downs, neglecting the underlying capital intentions. In fact, the 'appearance' of a single K-line and the combination patterns of multiple K-lines quietly tell you how the market may move next. Today, I will break down the most practical K-line interpretation methods and clarify them with practical examples for you to understand immediately.
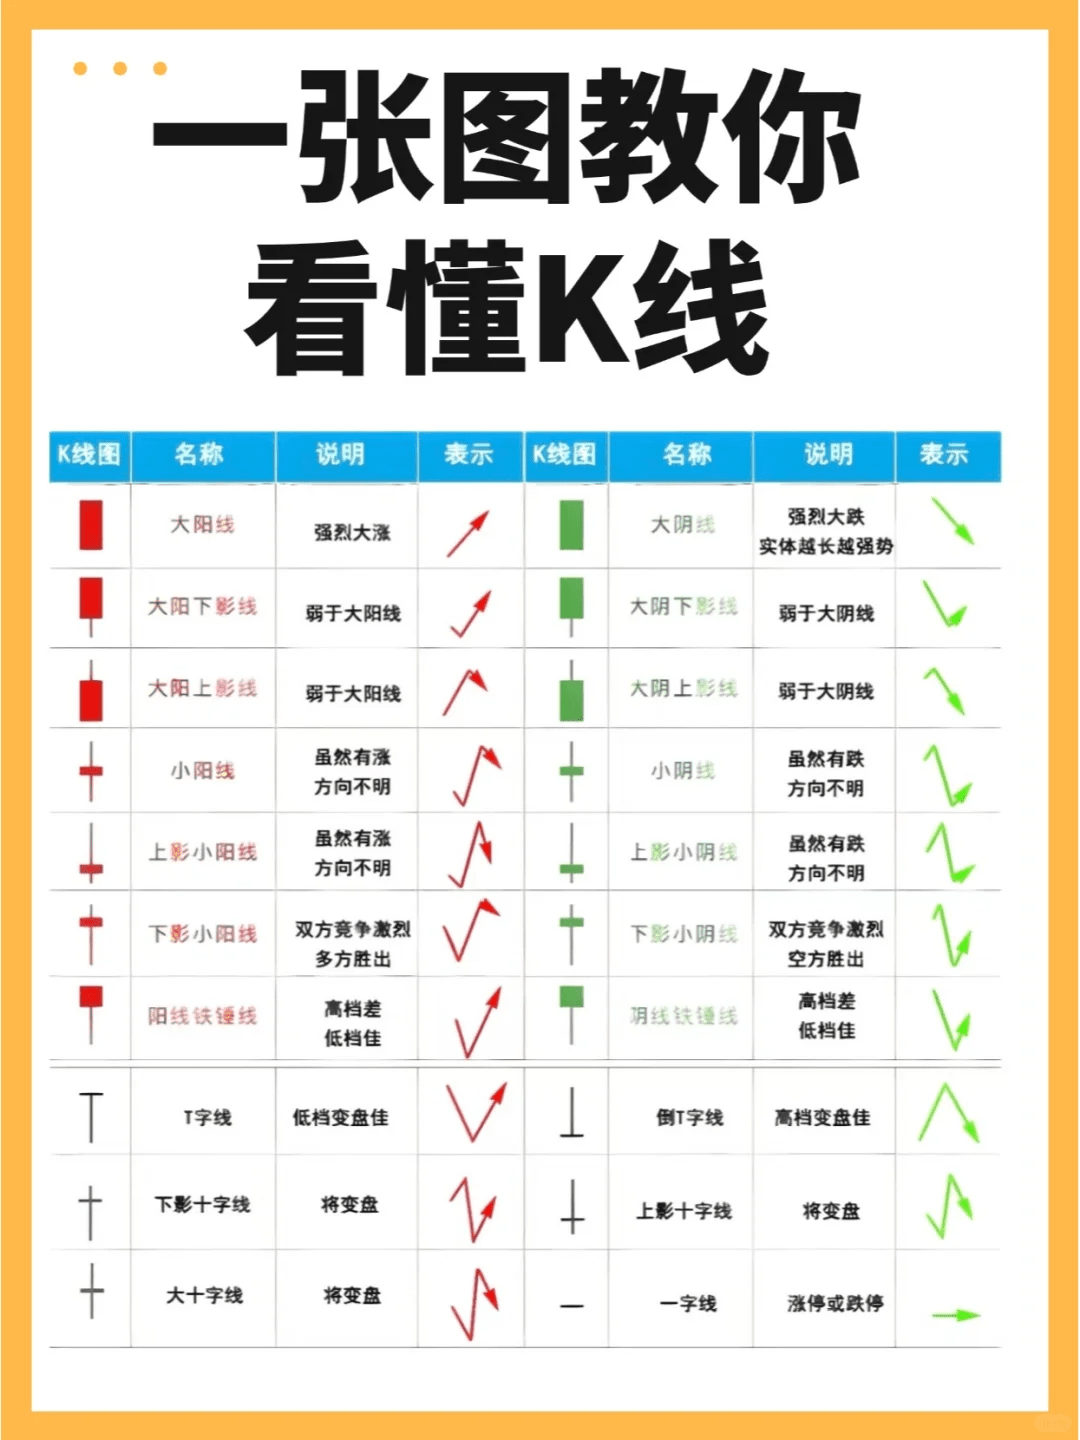
One, single K-line: Understanding 'body' and 'shadow' to grasp the power of bulls and bears
K-lines are like the 'expressions' of the market; bullish candlesticks are smiles, while bearish candlesticks are frowns, but just looking at the expressions is not enough; you have to look at 'the amplitude of the expressions' —
1. Bullish and bearish candlesticks: The capital attitude behind the ups and downs
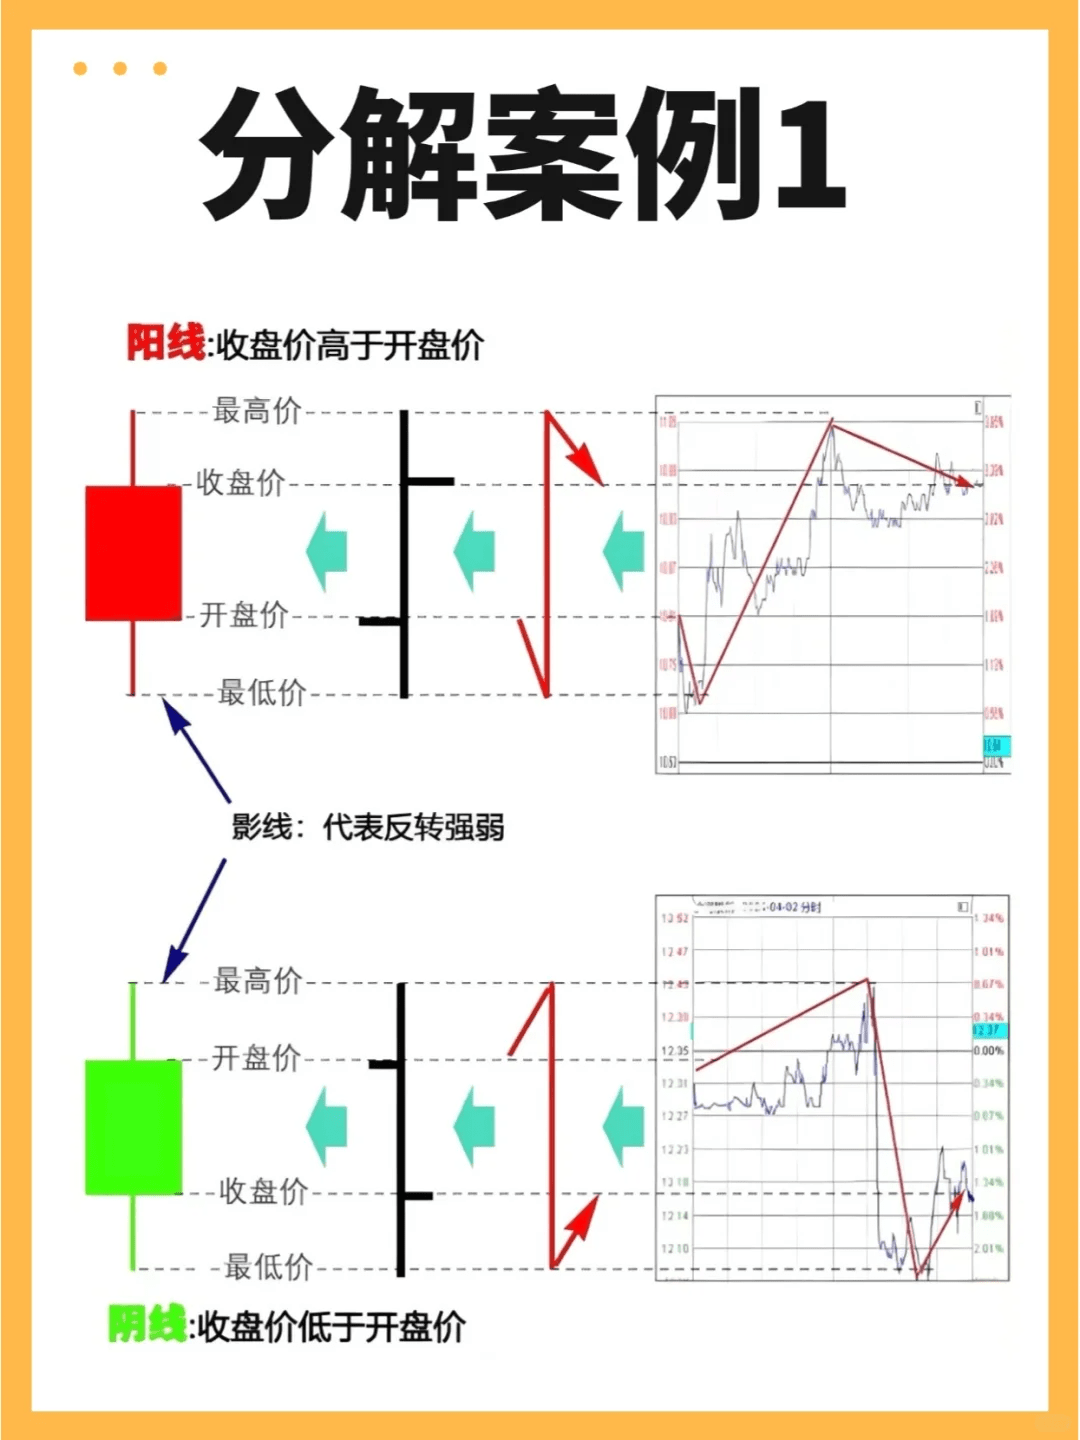
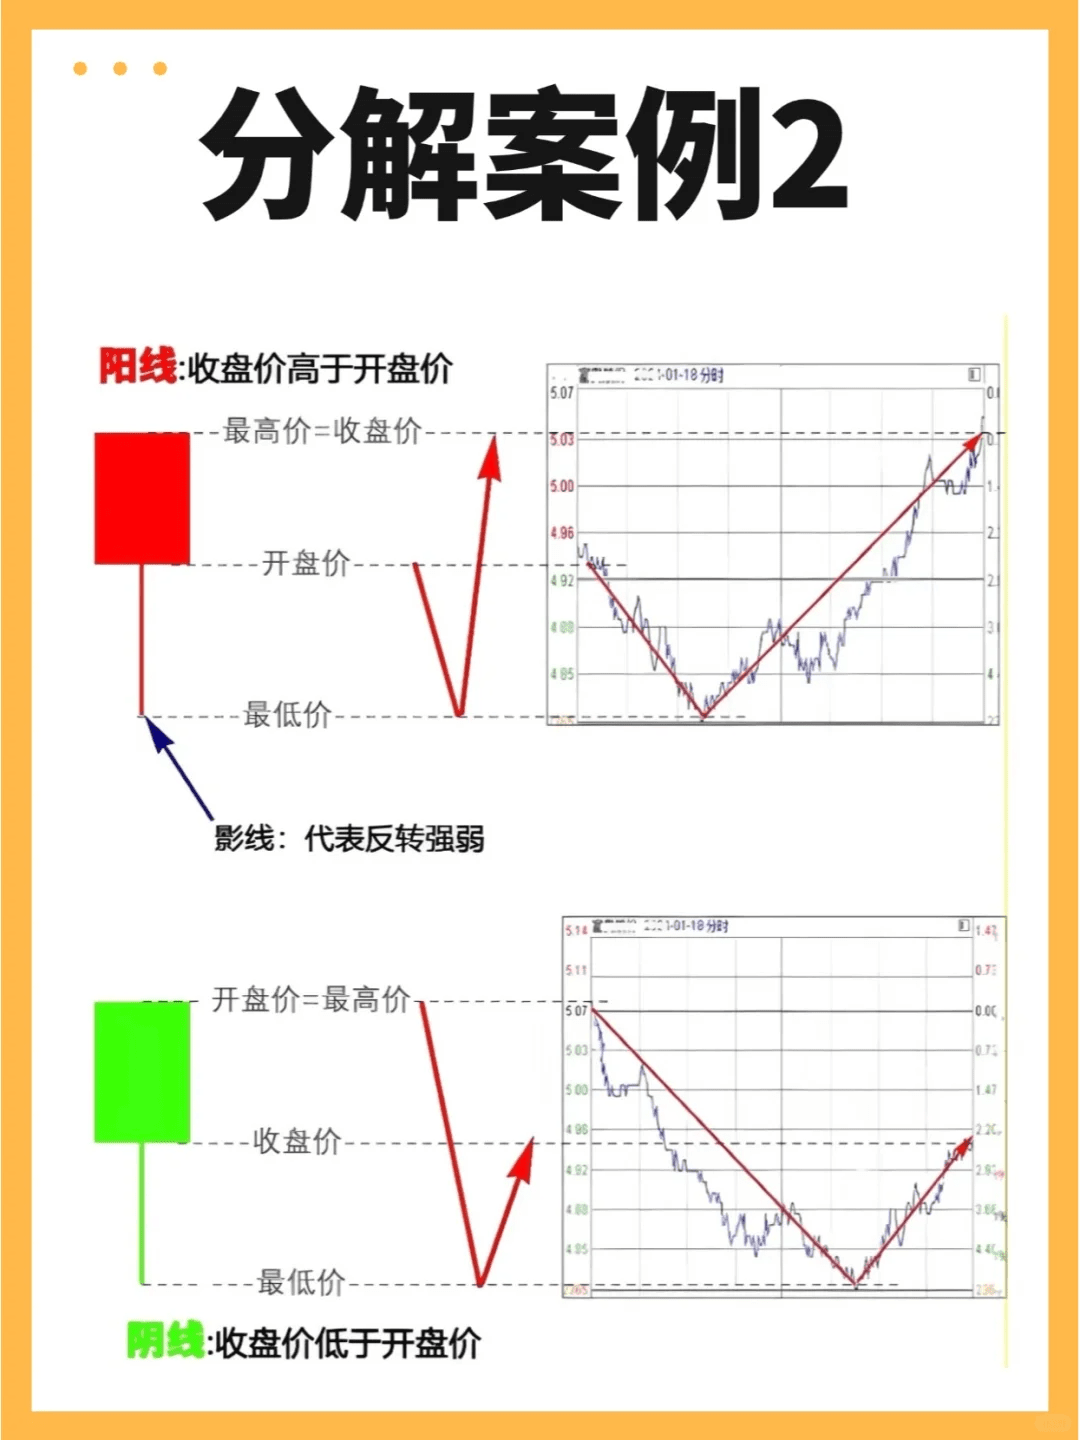
Bullish candlestick: The closing price is higher than the opening price, indicating that the bulls are dominant during that period. But be cautious: A small bullish candlestick at a low level may be a test, while a large bullish candlestick at a high level may be a bullish trap (for example, the large bullish candlestick when BTC surged to $69,000 in 2021, followed by a crash).
Bearish candlestick: The closing price is lower than the opening price, indicating that the bears are dominant. A large bearish candlestick at a low level may indicate panic selling (for example, this March when ETH dropped to $1800, the large bearish candlestick turned out to be a buying opportunity), while a small bearish candlestick at a high level may indicate that funds are quietly leaving.
2. The size of the body: A 'barometer' of attack strength
The longer the bullish candlestick body: The stronger the bullish attack. For example, BTC showed three consecutive large bullish candlesticks at $16,000, with the body length far exceeding the previous K-lines, which is a clear starting signal. At this time, using 30% of the funds from the '343 positioning method' to enter the market can essentially capture the main upward wave.
The longer the bearish candlestick body: The more aggressive the bears are. But it must be viewed in context: If an extremely long bearish candlestick appears after a continuous decline, it may be the 'last drop' (for example, many altcoins showed extremely long bearish candlesticks after LUNA's crash in 2022, then rebounded over 50%+).
3. Length of the shadow: The 'detector' of resistance and support
The longer the upper shadow: The more obvious the upward resistance. For instance, SOL showed a long upper shadow that was 2 times the body at $120, indicating that selling pressure above $120 is significant. At this time, according to the 'turning point trading' logic, it is a signal to reduce positions, and indeed it fell by 30% afterward.
The longer the lower shadow: The stronger the support below. ETH showed multiple long lower shadows at $3000, indicating that $3000 is strong support. At this time, using 40% of the funds from the '343 positioning method' to add positions in batches can lower the cost significantly, making it easy to profit during the rebound.
Two, K-line combinations: The patterns tell you 'whether the trend is reversing'
A single K-line is 'instant emotion'; a combination of multiple K-lines represents 'capital intention'. Be vigilant when these combinations appear —
1. Double bottoms and double tops: The market's 'reversal signal lights'
Double bottom (W bottom): During the downtrend, two roughly equal low points appear, with the second low not breaking below the first, followed by a rebound breaking the middle high point. For example, in 2023, BTC formed a double bottom at $25,000, breaking above $30,000 and directly surging to $48,000. At this time, using 30% of the funds from the 'trend accumulation' method to enter, profits can double directly.
Double top (M head): During the upward process, two close high points appear, with the second high not exceeding the first, followed by a drop below the middle low point. Last year, ETH formed a double top at $4500, decisively clearing out when it broke below $4000, avoiding a subsequent drop of $2000.
2. Head and shoulders bottom vs. head and shoulders top: More reliable reversal signals than double tops and bottoms
Head and shoulders bottom: In a downtrend, first the left shoulder appears, then a lower head, and finally the right shoulder (close to the height of the left shoulder), reversing after breaking the neck line. SOL's head and shoulders bottom pattern in October 2022 broke the neck line and rose from $10 to $100, using the '343 positioning method' to enter in batches, achieving an 8-fold return.
Head and shoulders top: In an uptrend, first the left shoulder appears, then a higher head, and finally the right shoulder, collapsing after breaking the neck line. The head and shoulders top pattern of BNB at $380 fell to $200 after breaking below $300, preemptively clearing out to avoid a 40% loss.
3. Pregnant line: Market 'hesitation' signal before a trend change
The previous K-line's body is very long, and the following K-line's body is completely contained within the previous one (for example, a large bullish candle followed by a small bearish candle). This pattern appearing at a high level is likely a signal of a peak (for example, the pregnant line of ADA at $1.8 in 2021, followed by a 60% drop); if it appears at a low level, it may be a bottom signal (for example, the pregnant line of DOT at $5 this year, followed by a 30% rebound).
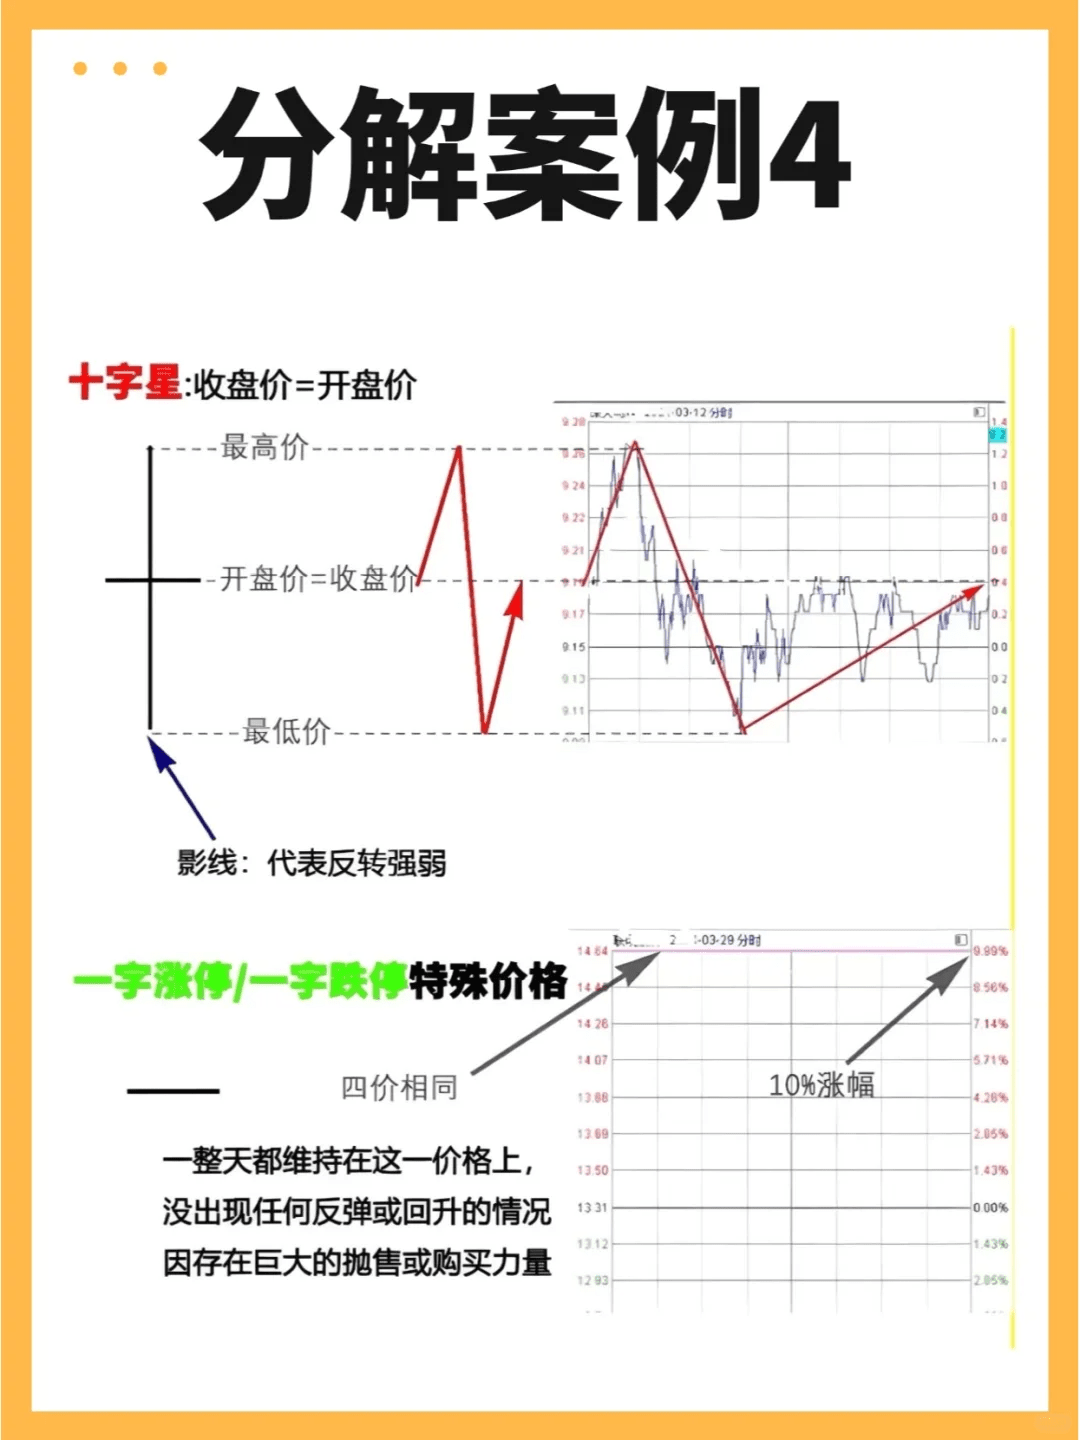
4. Doji: The 'critical point' of the bulls and bears battle
The opening price and closing price are almost the same, with shadows that can be long or short.
High-level doji: Significant divergence between bulls and bears, indicating that the whale may be unloading. For example, BTC's long doji at $69,000, followed by a crash to $30,000, regardless of how much profit, it’s always prudent to take profits according to discipline.
Low-level doji: Selling pressure is exhausted, signaling a potential bottom. ETH showed a doji at $880, followed by a doubling trend; at this time, using the first investment of 40% from the '343 positioning method' to enter has very low risk.
5. Red three soldiers and three crows: 'Early warning devices' for trend continuation or reversal
Red three soldiers: Three consecutive small bullish candlesticks with successively higher closing prices indicate that the bulls are steadily advancing. If it appears at a low level, it is a starting signal (for example, in 2023 DOGE's red three soldiers at $0.05, later rising to $0.12); if it appears at a high level, it may be a bullish trap (for example, SOL's red three soldiers at $200, then dropping 50%).
Three crows: Three consecutive small bearish candlesticks with successively lower closing prices indicate that the bears are dominant. If it appears at a high level, it is a precursor to a crash (for example, in 2022, AVAX's three crows at $140, then dropped to $10); but if it appears during an uptrend, it may be a short-term adjustment (for example, BTC's three crows at $50,000 in 2021, continued to surge to $69,000 after the adjustment). At this time, don't panic, using the 'batch accumulation' strategy can instead lower costs.
Three, practical mindset: K-lines are not isolated; they must be combined with 'these three dimensions'
The most common mistake when looking at K-lines is to look at the pattern while ignoring the environment. Remember:
Combining with trading volume: For example, red three soldiers accompanied by sustained volume increase are truly strong; while shrinking volume on red three soldiers may be a bullish trap (refer to the previous statement 'if volume doesn't increase, it’s a top signal').
Combining with key levels: If the double top does not break the neck line, it may just be a consolidation; the head and shoulders bottom confirming the neck line after a retest is a more reliable signal (for example, previously mentioned 'stabilizing above the 7-day moving average before increasing positions').
Combining with time periods: The double bottom on the 1-hour chart may just be short-term fluctuations, while the double bottom on the daily chart represents a major trend reversal (echoing '30 minutes for intraday trend, daily for overall direction').
I once successfully avoided the crash of DOT from $40 to $5 in 2021 by identifying the head and shoulders top on the daily chart; I also captured SOL's rise from $10 to $100 in 2023 by recognizing the red three soldiers on the weekly chart. These are not luck, but rather the combination of K-line signals and discipline — taking profit when it’s time, and not panicking when adding positions.
Understanding K-lines is not to predict ups and downs, but to know 'what the market is saying'. When the signals match your strategy, act decisively; when the signals are chaotic, hold back. This is the ultimate significance of K-line interpretation.
Different time periods of K-lines are like magnifying glasses of different multiples — the 4-hour chart helps you see the overall trend, the 1-hour chart helps you lock in the area, and the 15-minute chart helps you pull the trigger accurately. Missing any one can lead to a misfire.
One, 4-hour K-line: The 'navigation system' for trends, avoiding being misled by short-term fluctuations
The 4-hour K-line is a 'tool' for filtering noise. A single K-line contains the long and short battles of 4 hours, and compared to daily lines which are too blunt and hourly lines which are too chaotic, it can most intuitively present the medium-term trend:
In an uptrend: Continuous appearance of K-line combinations with 'higher highs and higher lows' (for example, BTC's rise from $30,000 to $60,000, with each pullback low on the 4-hour chart being higher than the previous one), at this time, use 30% of the funds from the '343 positioning method' to test the position, then add 40% when it pulls back to the support level on the 1-hour chart, which can capture about 80% of the main upward wave.
In a downtrend: The 4-hour chart shows 'lower highs and lower lows' (for example, in 2022 ETH dropped from $4800 to below $1000, with each rebound’s high being lower than the previous one), at this time any rebound on the 1-hour chart is an opportunity to short. Using the 'three-position method', cut losses once the moving average is broken, never linger.
In sideways oscillation: The 4-hour chart repeatedly shows 'upper shadows hitting resistance, lower shadows testing support' within a fixed range (for example, when SOL was ranging between $20 and $30, the 4-hour chart often rebounded after touching the upper and lower bounds), at this time, no matter how tempting the fluctuations on the 15-minute chart are, do not trade; frequent trading will only result in loss of fees.
Remember: The trend on the 4-hour chart is the 'root.' Operating against the 4-hour trend on smaller timeframes is like building a house on quicksand; it will collapse no matter how you build it.
Two, 1-hour K-line: Accurately locating 'battlefield' coordinates to find the most cost-effective entry point
After determining the direction on the 4-hour chart, the 1-hour K-line is the 'tactical map', helping you find the position with the highest safety margin within the trend:
In an uptrend: The support level on the 1-hour chart (such as the 10-day moving average, previous lows, trend lines) is a point to add positions. Last year, when BTC was rising at $40,000, the 1-hour chart would rebound every time it pulled back to the 10-day moving average. At this time, using 40% of the funds from the '343 positioning method' to add positions could lower the cost to the mid-trend, which is much safer than chasing high prices.
In a downtrend: The resistance level on the 1-hour chart (such as the 20-day moving average, previous highs) is a shorting point. When ETH was falling below $2000, the 1-hour chart would turn around every time it rebounded to the 20-day moving average, combined with the 'double top pattern', the win rate for shorting here exceeded 70%.
During sideways trading: The upper and lower bounds of the box on the 1-hour chart are the take profit and stop loss points. When BNB was ranging between $300-$350, a long upper shadow combined with increased volume near the upper bound at $350 would indicate taking profit, while a lower shadow combined with decreased volume at $300 would indicate a buy opportunity. Trading back and forth can earn more than holding on.
The key is: The signals on the 1-hour chart must be consistent with the 4-hour trend. For example, if the 4-hour trend is upward, only enter when the 1-hour chart shows 'bottom divergence + support level'; if the 1-hour chart shows a bearish signal but the 4-hour trend has not changed, it may just be a pullback, don’t rush to stop loss.
Three, 15-minute K-line: The 'last second' to pull the trigger, making the entry timing accurate to the minute
15-minute K-line is used to judge trends, and its only purpose is to 'find the best timing to shoot':
Entry signal: When a reversal signal such as 'engulfing pattern', 'morning star', 'golden cross', etc., appears at the support/resistance level locked in on the 1-hour chart, with trading volume increasing (for example, over 50% larger than the previous 3 K-lines), entering at this moment can allow you to enter 1-2 points lower than others, with a smaller stop loss space.
Pitfall: There are particularly many false signals on the 15-minute chart. For example, a small bullish candlestick appears at a support level without volume, which is likely a bullish trap; a small bearish candlestick appears at a resistance level with shrinking volume, which may be a bearish trap. You must wait for 'signal + volume + period resonance' before taking action.
For example, in May this year, SOL rose at $40 (the 4-hour trend was upward), the 1-hour chart pulled back to the $38 support level, and the 15-minute chart showed a 'lower shadow + high volume bullish candle'. Entering at this point led to a rise to $52 in 3 days, earning 3 more points compared to entering directly on the 1-hour chart, with stop loss set at $37, resulting in very low risk.
Four, 'life-saving mantra' of multi-period coordination
Don't act when out of sync: If the 4-hour is rising, but the 1-hour shows a top divergence, even if the 15-minute gives a signal, do not go long; it may be a bullish trap; if the 4-hour is falling and the 1-hour shows a bottom divergence, it’s likely a rebound trap.
Smaller timeframes must obey larger timeframes: No matter how strong the 15-minute chart is, as long as the 4-hour chart is still in a downtrend, treat it as a rebound, take profits decisively, and don’t fantasize about reversals.
Stop loss looks at the small timeframe, and take profit looks at the larger timeframe: Entering on the 15-minute chart, set the stop loss at the key level of that timeframe (for example, the previous low); take profit should consider the resistance level on the 4-hour chart, don't get scared out by small fluctuations on the 15-minute chart.
I once bought the dip while ignoring the 4-hour downtrend by only looking at the 1-hour chart, and ended up being deeply trapped; I also tried ignoring the 15-minute signals and directly entering at the 1-hour support level, ending up with a cost 3 points higher than others, resulting in a 50% loss when cutting losses. These painful lessons prove that multi-period coordination is not a hassle, but a 'safety belt' for survival in the crypto space.
Ultimately, the K-line cycles in the cryptocurrency space are just like getting dressed — the 4-hour chart is the outer coat (defining style), the 1-hour chart is the shirt (defining fit), and the 15-minute chart is the tie (defining details). Wearing just one piece may be okay, but coordinating them well can keep you warm and looking good. More reviews and practice will make this method muscle memory, and you will find that making money is really not that difficult.


