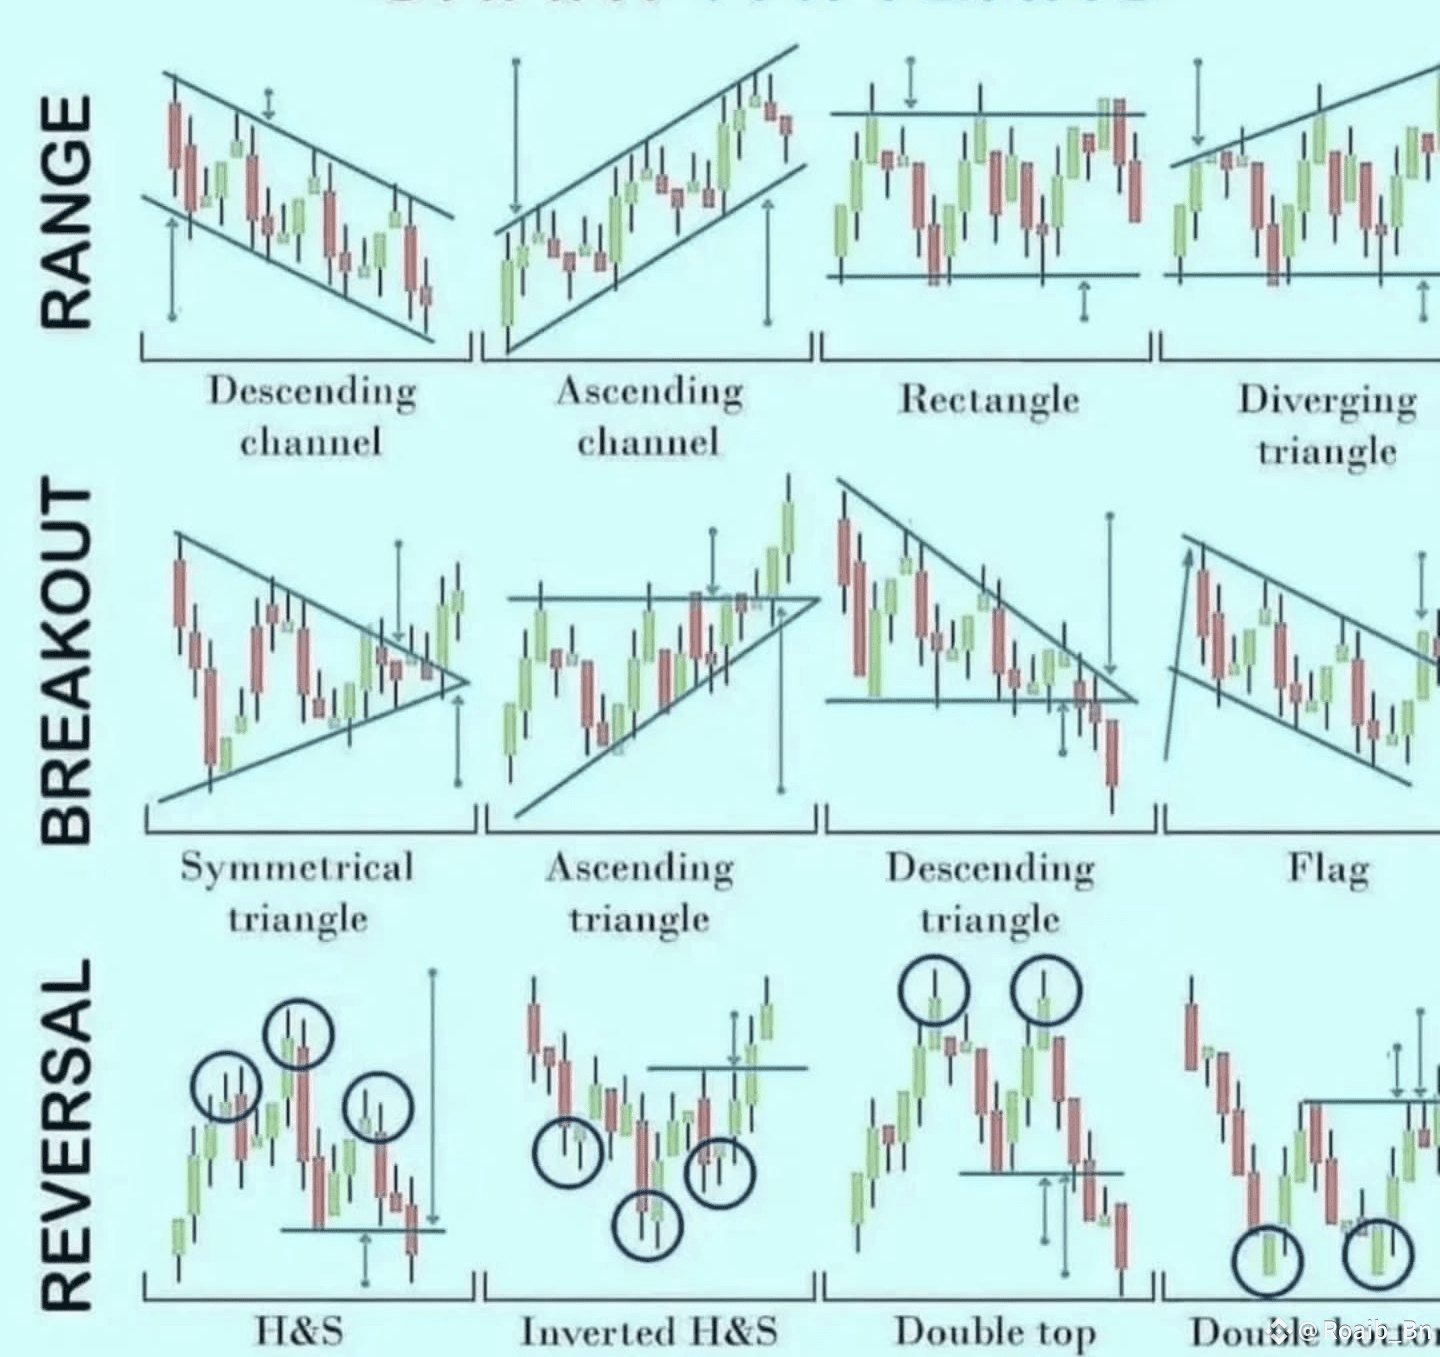
📊 Range Patterns
🔹 Descending Channel
Price moves lower within parallel downward lines.
Trade the range or wait for breakout.
🔹 Ascending Channel
Price rises inside upward sloping lines.
Often continues bullish unless breakdown occurs.
🔹 Rectangle
Sideways range between horizontal support/resistance.
Breakout signals next major move.
🔹 Diverging Triangle
Widening price range with higher highs and lower lows.
Indicates volatility; breakout is usually sharp.
---
🚀 Breakout Patterns
🔹 Symmetrical Triangle
Price consolidates with converging highs/lows.
Breakout can go either direction—watch volume.
🔹 Ascending Triangle
Flat resistance with rising lows.
Bullish breakout is common.
🔹 Descending Triangle
Flat support with falling highs.
Typically breaks down bearish.
🔹 Flag
Short-term consolidation in a sloping channel.
Follows a strong trend and continues in same direction.
---
🔄 Reversal Patterns
🔹 Head & Shoulders (H&S)
Three peaks, middle one highest.
Bearish reversal when neckline breaks.
🔹 Inverted H&S
Three dips, middle one lowest.
Bullish reversal on breakout above neckline.
🔹 Double Top
Two similar highs with a dip between.
Bearish signal once support breaks.
🔹 Double Bottom
Two similar lows with a peak between.
Bullish reversal when resistance breaks.
HERE is the candles image 👇
IF you find the post helpful then please follow like and comment on it thanks 👍
#BTCvsETH #StablecoinLaw #GENIUSAct #BinanceHODLerERA #AltcoinBreakout
