FILL YOUR BAGS
📊 Chart Analysis & Technical Breakout
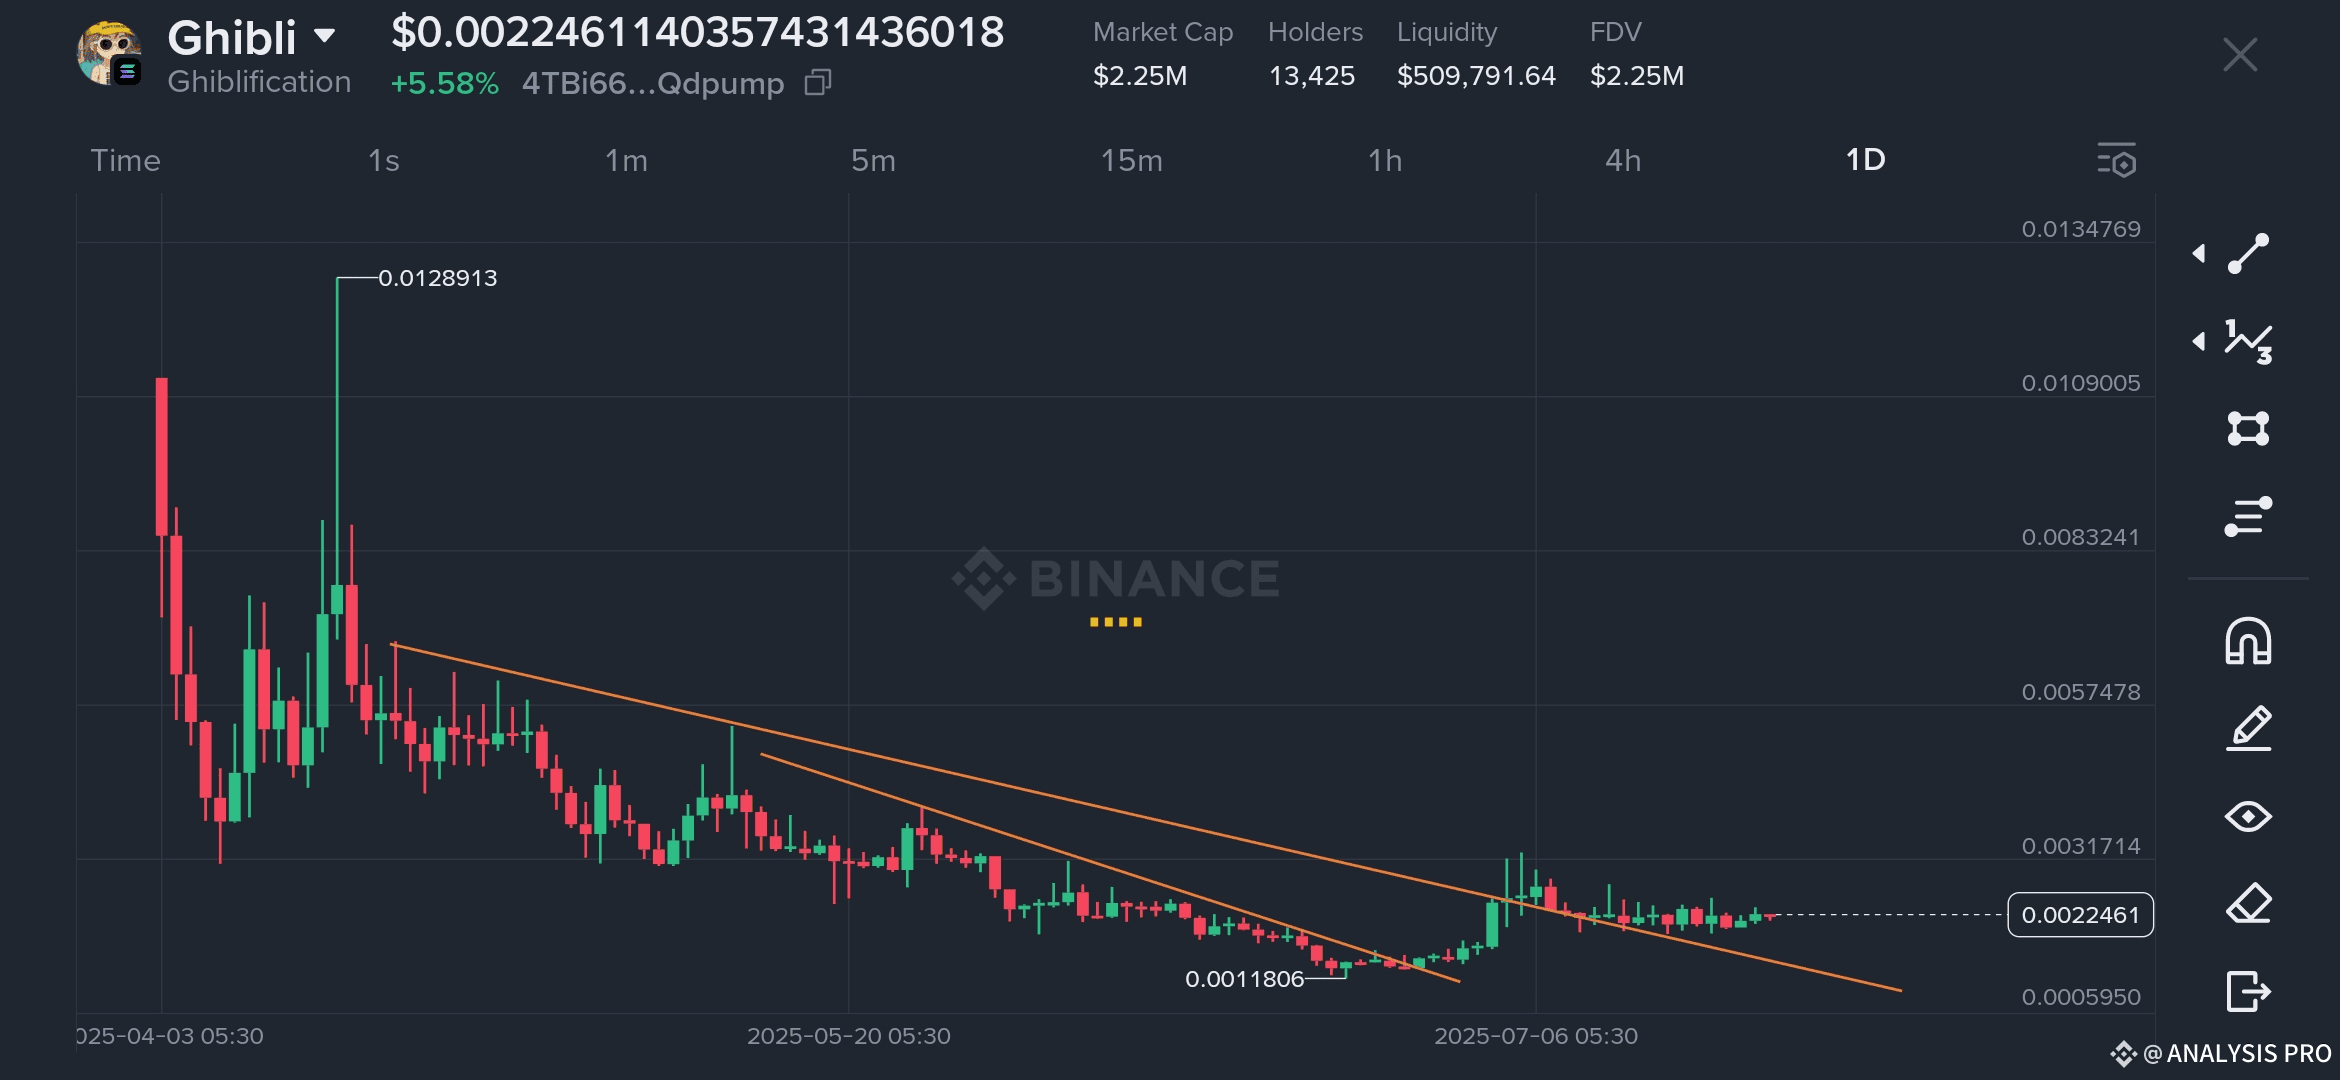
The daily candlestick chart reflects a clear downtrend reversal:
The token reached a peak of $0.01289 in early April 2025, followed by a prolonged decline.
A descending triangle and multiple resistance touches formed a strong downtrend, which the token respected until early July.
The price bottomed at $0.0011806 before staging a breakout, clearly piercing the descending trendline resistance.
Post-breakout, Ghibli has been consolidating sideways above the previous trendline, suggesting accumulation and potential for a further rally.
This breakout from the downtrend is a bullish indicator, supported by rising volume and market interest. If the momentum continues, the next resistance levels could be around $0.0031, $0.0057, and $0.0083.
The recent price movement shows increasing market confidence, likely driven by social sentiment, breakout traders, and early community believers.
Short-Term: The breakout above trend resistance opens the door for short-term gains if momentum sustains.
Mid-Term: Accumulation above the trendline can build a base for another move upward.
Long-Term: Ghibli’s future will heavily rely on continued community growth and utility development, potentially through NFTs, games, or branded content.
⚠️ Conclusion
Ghibli Token is showing signs of revival after months of downtrend. With a confirmed breakout and strong liquidity, it may become a standout among niche memecoins—especially if it continues aligning itself with artistic and cultural themes.
Disclaimer: This article is for informational purposes only and not financial advice. Always do your own research before investing in cryptocurrencies.