📈 Technical Analysis: Range Breakout Confirmed
Your chart highlights a clear breakout from a long-term accumulation zone. Here’s the technical interpretation:
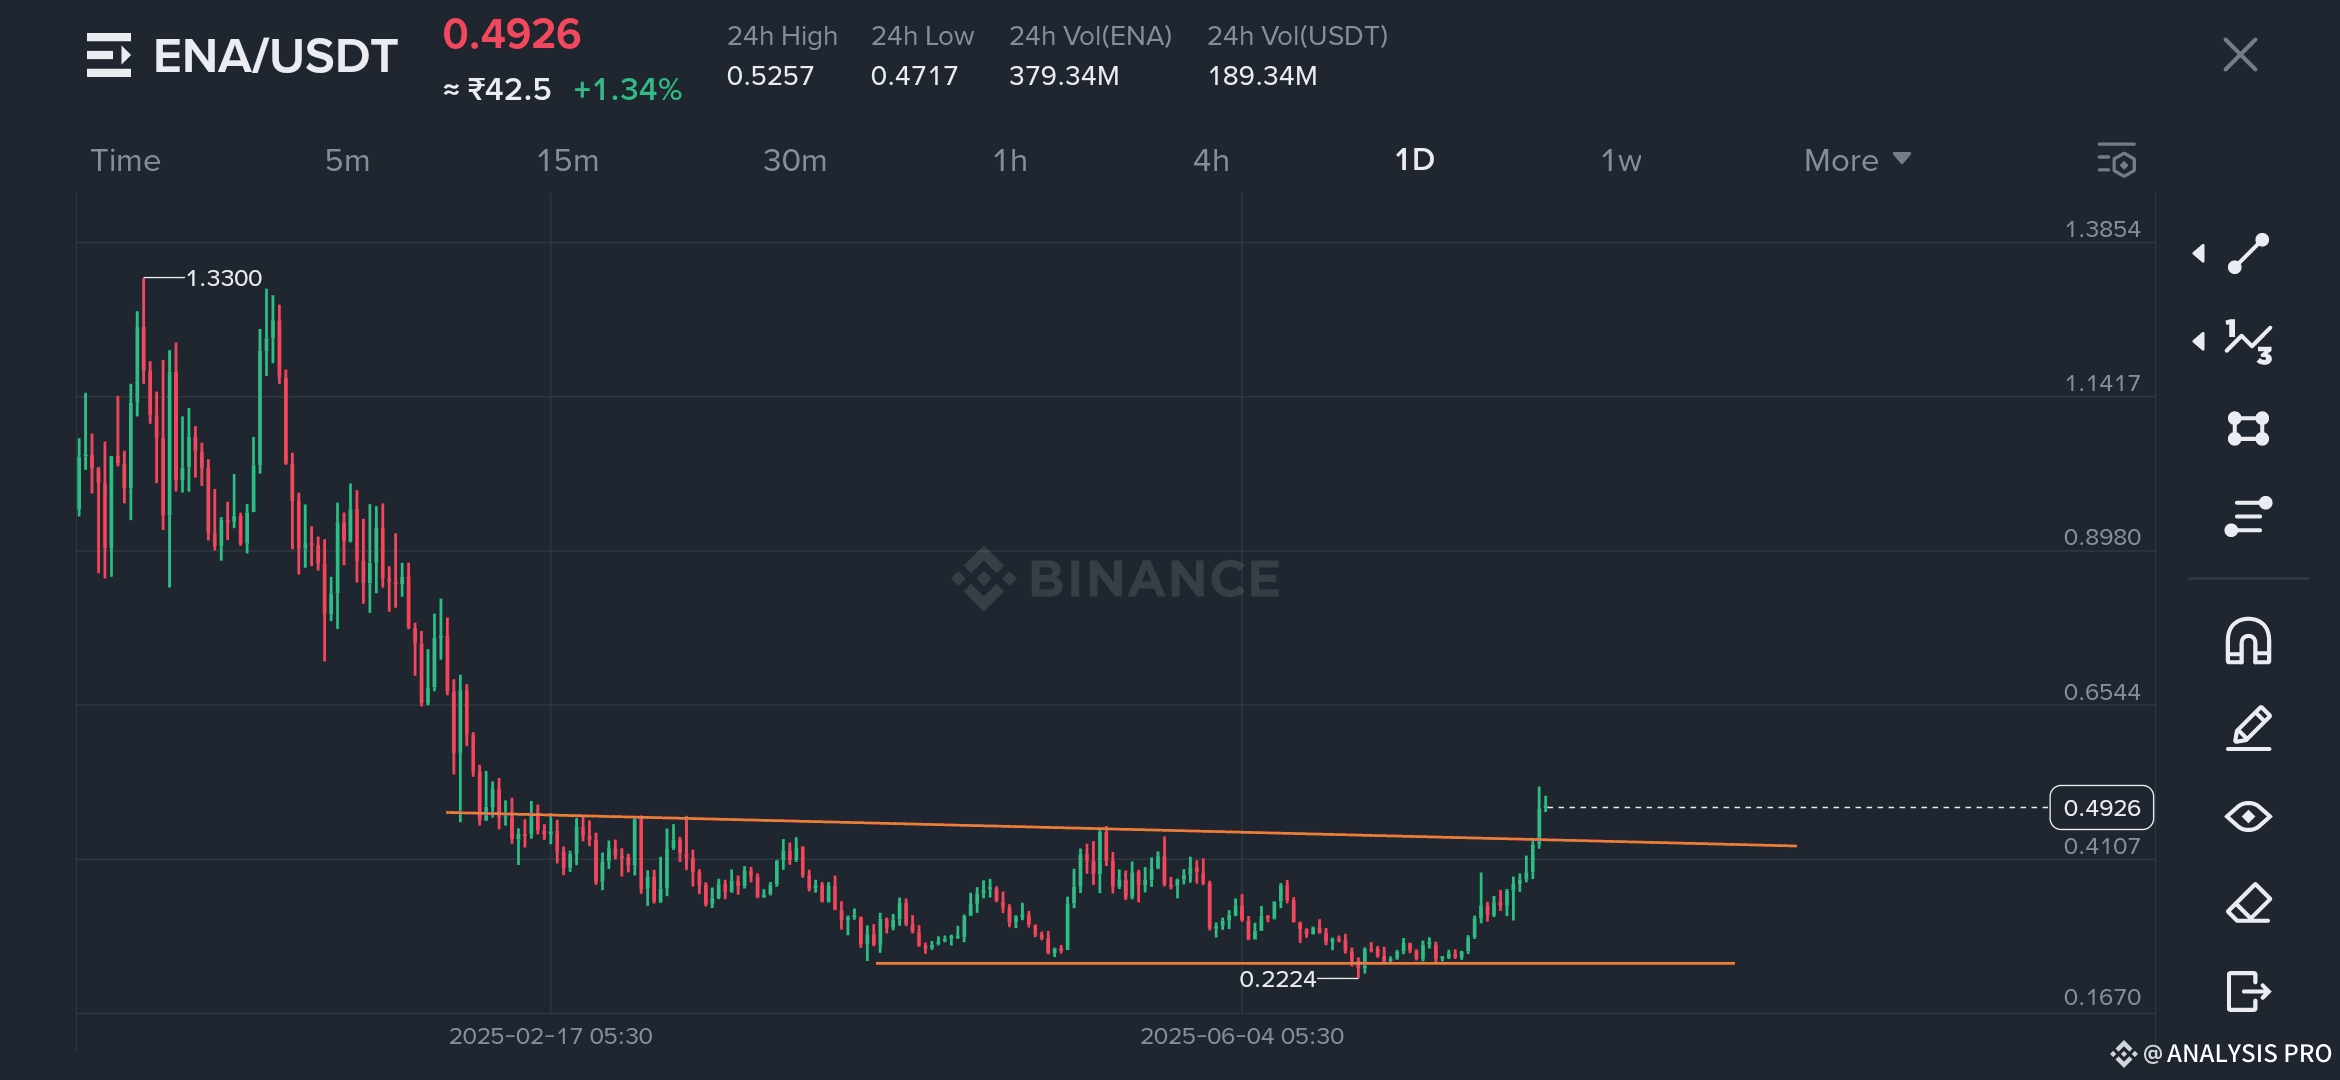
🔻 Historical Downtrend
ENA fell from $1.33 to a low of $0.2224, consolidating in a tight range for months.
🟢 Accumulation + Breakout
Price formed a horizontal support near $0.222 and resistance at $0.41.
The breakout above $0.41 with strong volume marks a bullish shift in trend.
📈 Volume Spike
Volume increased significantly with the breakout, confirming bullish participation.
This suggests a genuine move, not just a temporary pump.
🔑 Key Levels to Watch
Level Type Significance
$0.222 Support Historical bottom
$0.410 Previous resistance Now turned support
$0.492 Current price Just broke resistance
$0.654 Next resistance Mid-term target
$0.898 Resistance Strong resistance from previous range
$1.33 ATH Long-term breakout level
🔥 Why ENA Could Rally Further
Breakout Confirmation: Strong technical breakout with volume.
Low Market Cap Relative to Utility: ENA still undervalued in terms of protocol growth.
Institutional & Developer Support: Ongoing innovation on the Ethena platform.
Stablecoin Demand: As DeFi demand for decentralized stablecoins increases, USDe and ENA may benefit.
⚠️ Risks to Keep in Mind
Synthetic Peg Risk: USDe is not backed by fiat; risks arise from complex delta-neutral mechanisms.
Regulatory Uncertainty: Synthetic stablecoins are often in regulatory gray areas.
Market Volatility: If BTC/ETH correct heavily, ENA could retrace short term.
📌 Conclusion: ENA Turns Bullish, Eyes $0.65–$0.89 Next
ENA has finally broken out of its long accumulation zone, potentially signaling the start of a new bullish cycle. If the breakout holds, it may soon test resistance levels at $0.65 and $0.89.
Short-Term Bias: Bullish
Entry Zone: $0.42–$0.48 (pullback opportunity)
Stop-Loss: $0.39
Targets: $0.65 → $0.89 → $1.33
