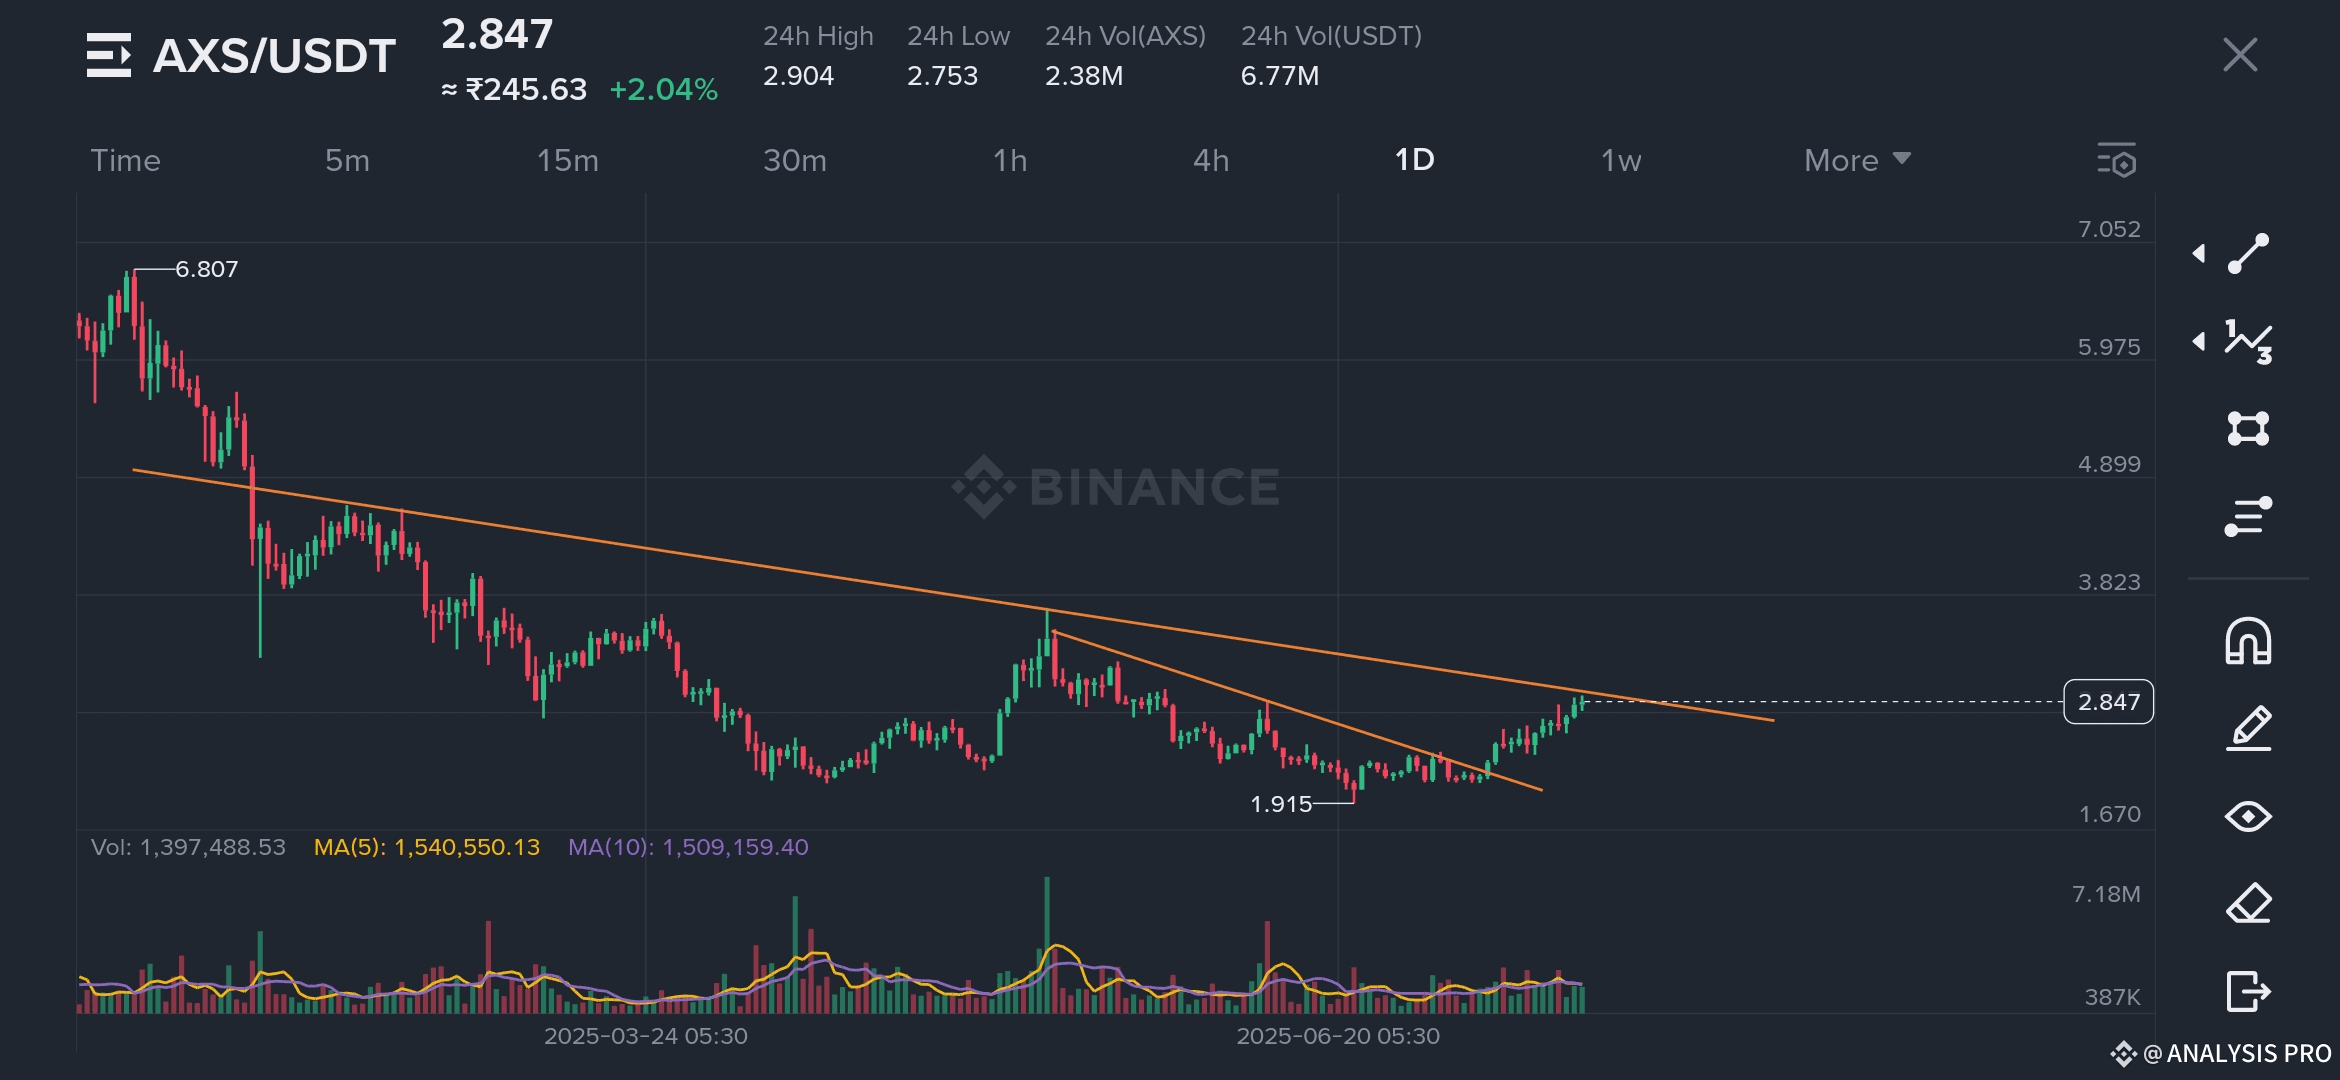
📊 AXS Market Overview (as of July 21, 2025)
Current Price: $2.847
INR Equivalent: ₹245.63
24h High / Low: $2.904 / $2.753
Volume (AXS): 2.38 million
Volume (USDT): 6.77 million
Local Bottom (Chart): $1.915
Recent High (Chart): $6.807
📈 Technical Analysis: Dual Trendline Near Breakout
Your chart reveals an interesting multi-month falling wedge pattern, with two descending resistance lines converging. Here’s the breakdown:
🔻 Historical Downtrend
After peaking near $6.807, AXS experienced a major decline, mirroring the downturn in play-to-earn enthusiasm.
🟢 Recent Reversal Signs
AXS bounced from a key support level around $1.915.
It’s now testing a double descending resistance zone between $2.85–$2.90.
Price is holding above short-term MAs (Moving Averages), indicating rising momentum.
📊 Volume Observation
Gradual increase in volume supports the price movement.
The current setup resembles a pre-breakout coil, where a surge may follow.
🔍 Key Price Levels to Watch
Level Significance
$1.915 Strong support (recent bottom)
$2.85–$2.90 Resistance zone (breakout zone)
$3.82 Minor resistance post-breakout
$4.89 Mid-term resistance
$6.80 Long-term target (previous high)
🧠 Conclusion: AXS Testing a Make-or-Break Zone
AXS is currently testing a crucial trendline resistance. A clean breakout above $2.90 with volume confirmation could trigger a run toward $3.80 and possibly $5+ in the medium term. However, failure to break out may result in another retest of lower support near $2.40 or $2.00.
Short-term bias: Bullish above $2.90
Target zones: $3.82 → $4.89 → $6.80
