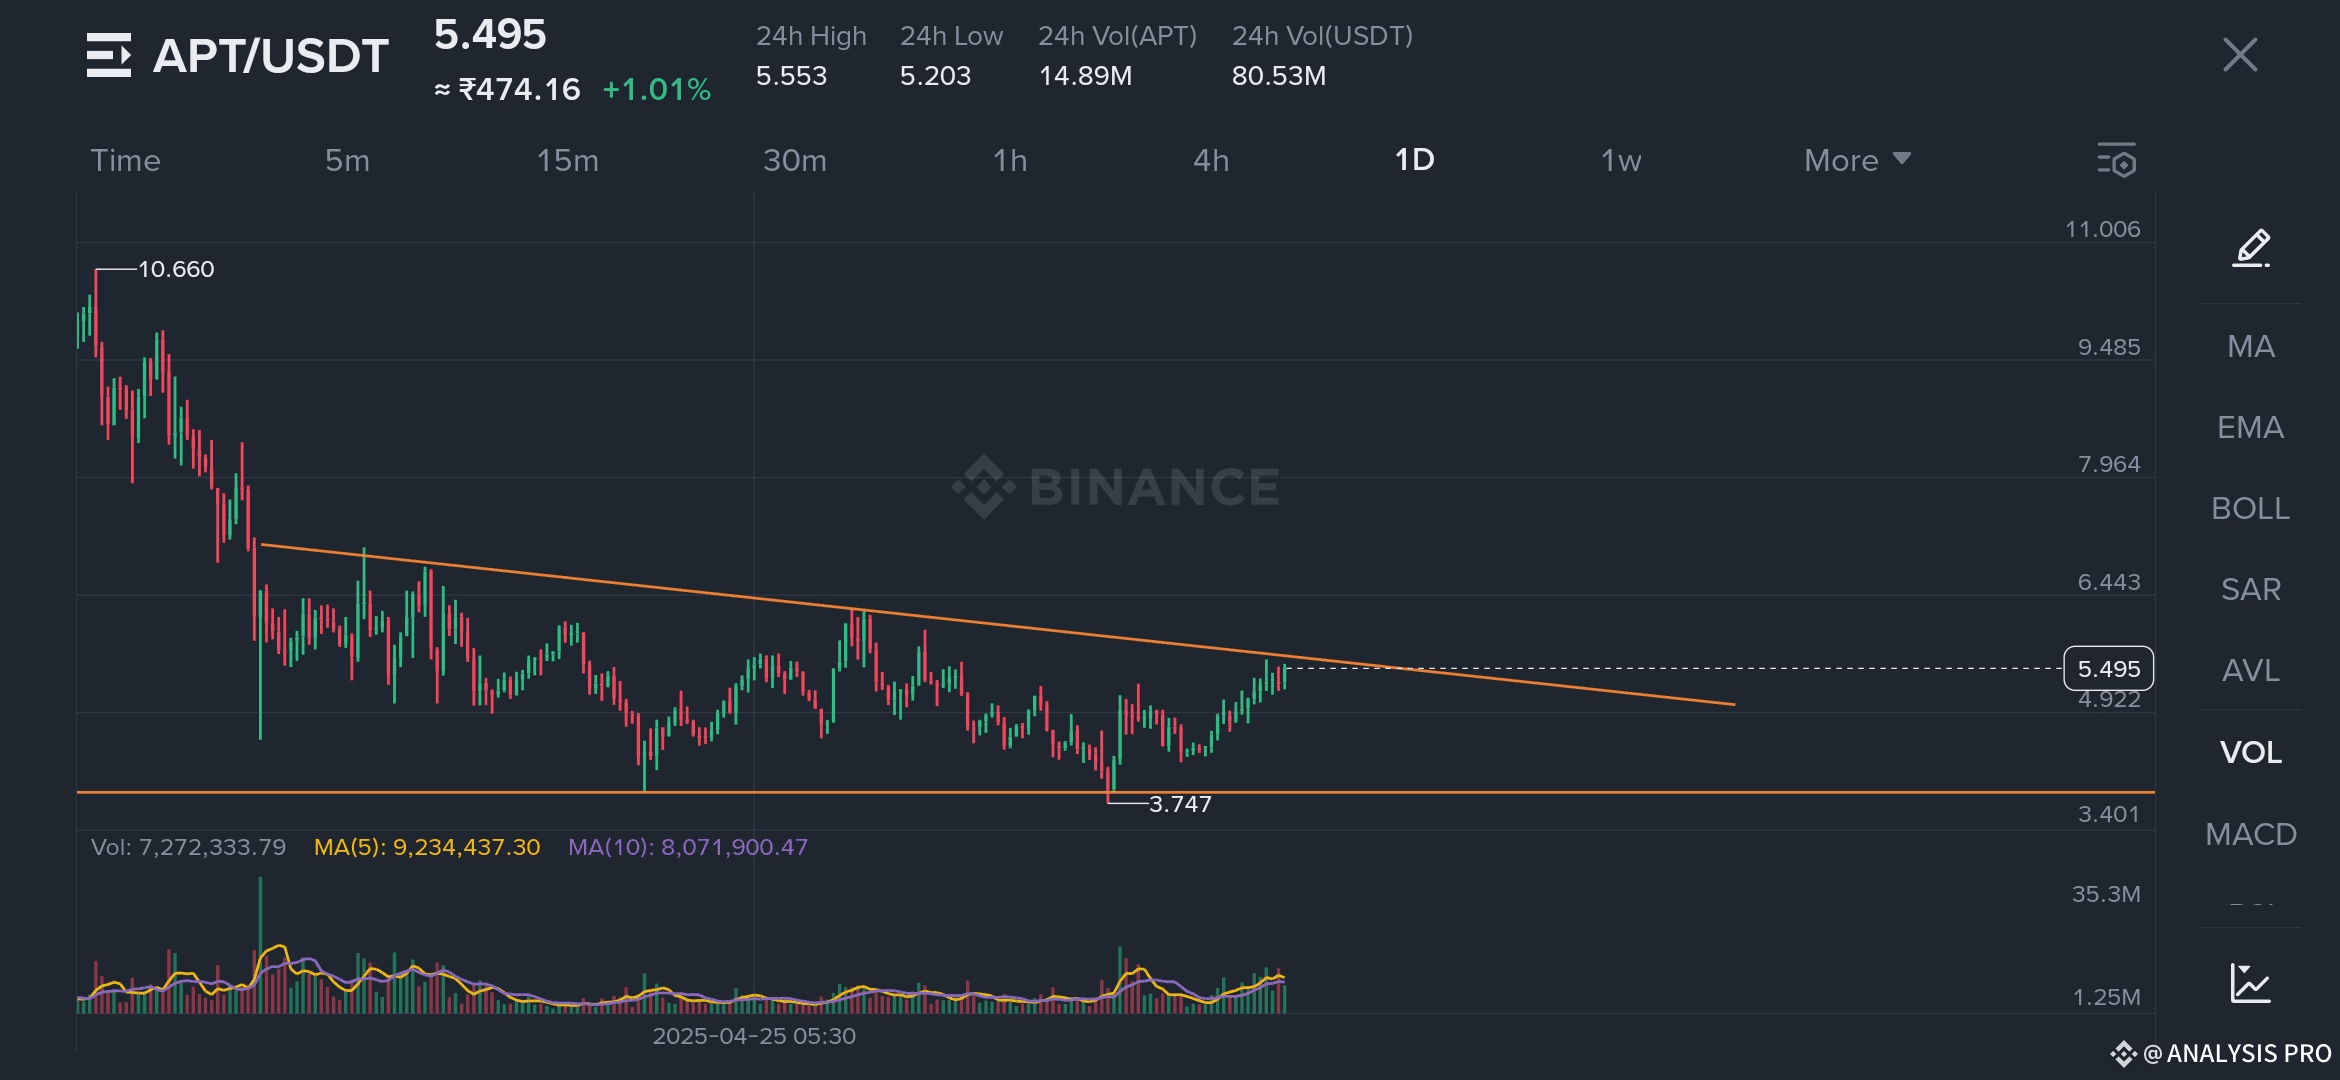
Pair: APT/USDT
Current Price: $5.495
24h Change: +1.01%
24h High / Low: $5.553 / $5.203
Volume (APT): 14.89M
Volume (USDT): 80.53M
Chart Interval: 1 Day (1D)
Exchange: Binance
Chart Analysis
📉 Descending Triangle Setup
APT has been in a prolonged downtrend since peaking at $10.660.
The descending resistance line has repeatedly capped upward moves, while horizontal support around $3.747 has held firm.
The price has now compressed near the upper boundary, suggesting a breakout or breakdown is imminent.
📈 Recent Price Action
APT has recently bounced from the $3.74 base and has rallied to $5.495, brushing against the long-term descending resistance line.
Price is consolidating just under this line, and a successful daily candle close above $5.55 could trigger further upside momentum.
Volume & Momentum Indicators
Volume Spike: Noticeable increase in volume as price approaches resistance — a sign of growing interest.
Moving Averages: The 5-day MA is above the 10-day MA, suggesting short-term bullish sentiment.
MACD/RSI (not visible here): Typically in breakout setups like this, RSI begins to climb out of neutral territory (~50), and MACD crosses bullishly — worth checking directly on a full chart.
Key Levels to Watch
Level Type Comment
$3.747 Major Support Held firm for months; demand zone
$5.50–$5.55 Immediate Resistance Breakout zone from triangle
$6.44 Intermediate Target Resistance from previous range
$7.96 Mid-Term Target Range top before steep decline
$10.66 Long-Term Resistance All-time high level
Fundamental Factors Driving APT
Strong Developer Backing: Built by former Meta engineers with a focus on scalability and security.
Growing Ecosystem: Increasing number of DeFi, NFT, and gaming projects on Aptos.
VC Backing: Heavily backed by top-tier funds like a16z, Jump Crypto, and Binance Labs.
Narrative Revival: As interest grows in alternative L1 chains, Aptos could benefit from narrative rotations.
Price Forecast & Scenarios
🚀 Bullish Case
A daily close above $5.55 would confirm a breakout from the descending triangle.
This could ignite a move toward $6.44, and eventually $7.96, especially if volume remains strong.
🐻 Bearish Case
If APT fails to break $5.55 and gets rejected, it may return to test support at $4.92 and possibly $3.75.
Breakdown below $3.74 would invalidate the current base and potentially send APT toward $3.40 or lower.
Conclusion
APT is at a make-or-break point, trading just below a significant descending resistance. A breakout could mark the end of a months-long downtrend and usher in a bullish phase targeting higher resistance zones. However, a rejection here could reinforce the bear structure.
Traders should watch for:
A decisive breakout above $5.55
A surge in volume confirmation
Stability above previous highs
This is a critical zone for APT, and the next few candles could determine its medium-term direction.
