Follow me and learn Web3 from scratch, from a novice to an expert, get started easily!
What is a cryptocurrency contract? Let me share some thoughts on it!
Hey, recently a friend asked: What is a cryptocurrency contract?
In fact, contracts are the "futures" of the cryptocurrency world, but people in the cryptocurrency world insist on calling them contracts. Why? Because every transaction is like two people signing a "future price bet"!
What does a contract mean?
To put it simply, the essence of a contract is that two people disagree on the future price of a currency:
One person thinks the price will rise in the future and wants to buy more;
Another person thinks the market will fall in the future and wants to buy short;
So, the two people "signed a contract" to bet. Whoever is right will make money, and whoever is wrong will lose money.
Please note that the unit of the contract is "sheet". For example, when you buy 1 contract, you are not buying physical currency, but participating in this "price prediction game".
️How to play the contract?
Let's take an example:
Suppose you bought a Bitcoin contract and the current Bitcoin price is $30,000;
You choose 5x leverage, invest $6,000, and control a $30,000 contract.
Next, you have two options:
Go long: Think that the price of bitcoin will rise, buy more;
Short selling: If you think the price of bitcoin will fall, buy short.
Profits and losses are directly linked to price fluctuations and leverage, for example:
Increase to $32,000: You have made $10,000 ($2,000 x 5x leverage);
Drop to $28,000: You lose $10,000 ($2,000 x 5x leverage).
Finally, when you feel that it is about right, you can "close the position" (exit the transaction) to lock in profits or stop losses.
Advantages of contracts
1️⃣ Can magnify profits: Use small capital to play big orders, and the returns will be huge (of course, the risks will also be magnified ⚠️).
2️⃣ Flexible short selling: There are opportunities to make money in a bear market, and you can make money whether the market goes up or down.
3️⃣ No need for delivery: No need to actually buy coins, directly settle profits and losses, convenient and hassle-free!
⚠️ Risks of the contract
1️⃣ Leverage risk: The higher the leverage, the faster the liquidation. If the price of the currency moves slightly, the account will be ruined...
2️⃣ The market is volatile: The cryptocurrency market is already volatile, and the contract market is even more exciting, so you need to be strong enough to play.
3️⃣ Funding rate: Perpetual contracts may have handling fees, and the cost will be maxed out over time.
4️⃣ High complexity: For novices, the various rules and strategies in the contract are a bit confusing.
How do newbies play?
Don’t be greedy for leverage: Use a small leverage (2-5 times) first, don’t go all in 100 times, keep the principal and play a few more times!
Control risks: Use stop-profit and stop-loss to protect yourself, and don’t always think about “taking another gamble”.
Spend less “tuition money”: Only use your spare money to try it, the kind that won’t affect your life if you lose it.
Finally, I would like to summarize:
Contract trading is actually a zero-sum game. If you play well, you will make money quickly, but if you are not careful, you may also get liquidated easily. Newbies must take their time. If you don’t understand, read more and learn more. Don’t be cut off as soon as you enter the cryptocurrency circle!
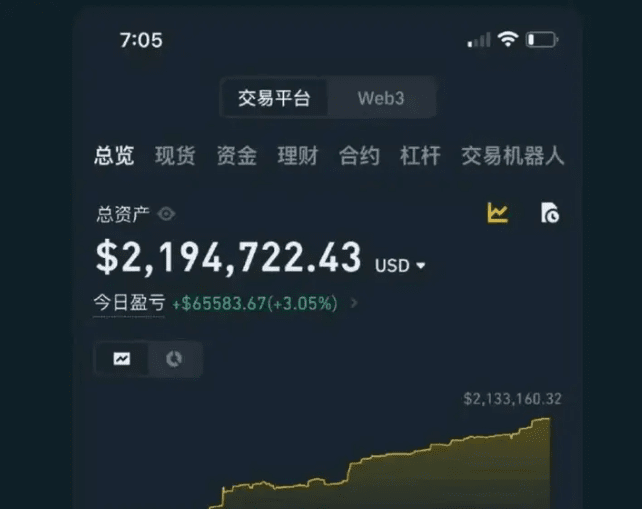
In 2024, I started trading cryptocurrencies full-time. In 11 months, I made more than 2 million U from 2000 U contracts, which is a 1000-fold increase in profit.
In the cryptocurrency world, if you want to truly achieve financial freedom and realize compound interest, methods and techniques as well as forming your own profit system are crucial!
Once you learn how to master it, the cryptocurrency world will be like your "cash machine", and making money will be as easy as breathing!
After more than 10 years of cryptocurrency trading, my road to wealth is summarized as follows:
The first ten million took the longest time and was the most painful. The trading system was constantly reshaped and polished, which took a year and a half.
The second 10 million took three months
The third 10 million took only 40 days
The fourth 10 million took only 5 days
75% of the funds were earned in half a year.
A great way to make money without blowing up your contract! 99% accuracy!
If you have a capital of $5,000 and want to make a peace contract, remember to use only 10% at most, which is $500, and keep the remaining $4,500 for adding to your position. Let me share several ways to make money.
The first one:
Focus on one coin, only Bitcoin!
Don't believe in those fake coins, and don't be greedy. You come to the cryptocurrency circle to make money, not to lose money. I used to trade many coins at the same time, but the result was either liquidation or huge losses, or I was always stuck.
Second type:
When opening an order, a stop loss must be included. If the market fluctuates greatly, the order will be adjusted far away; if the market fluctuates slightly, the order will be adjusted close.
You don't need to set a stop loss, but you must set one. No one can predict when the market will soar or plummet. If the stop loss is set well, even in extreme situations, most of the principal can be preserved. Don't set a stop loss for fear of loss, or imagine that you can get out of the trap immediately after being trapped. This idea is too naive.
The third type:
The forced liquidation price should be set far away, preferably in half and then cut in half again.
The fourth type:
Adding positions should be planned, don’t do it blindly.
The remaining capital after opening the order should be enough to increase the position at least 4 times. For example, the first increase is 30 dollars, the second is 60 dollars, the third is 120 dollars, and the fourth is 240 dollars. In this way, if the market adjusts appropriately, it is easy to get out of the position or even make a big profit.
Fifth:
Open a hedge with the same coin and use it when you are desperate.
If you have done all the previous ones, then there is little point in opening a hedge. But remember, this method can only increase the position once, so you must be clear whether you are opening a hedge or adding a fourth position.
Sixth type:
Don't open hedges with different currencies.
Some people like to use several similar currencies to open hedging contracts, which is very undesirable. It is difficult to understand one currency, and if you add another, the operation will be distorted, and in the end, they will be trapped.
Seventh:
Open orders according to the bull and bear markets, don't go against the trend.
Don’t open short orders easily in the early stage of a bull market, and don’t open long orders easily in the late stage of a bull market. Don’t let the intraday market influence your judgment, and end up opening at the top or bottom of the mountain.
In fact, contracts are not for ordinary players.
1. Fund management must be good. With a leverage of 0-100x, short-term losses are inevitable. The single risk should generally not exceed 2%-3%, and aggressive players can reach 5%-8%. If the risk exceeds 8%-10%, the drawdown in the unfavorable period will reach 70%, and the average person's mental breakdown point is around 50%. Fund management must be strictly enforced.
Many people like to trade 5x or 10x, and their trading level is above 4h. The stop loss of the trading level above 4h is generally 5%-15%, and the risk of a single transaction has reached 25%. Doing so is like seeking death. In order to ensure the risk level and high leverage at the same time, the level must be lowered to 1 hour, 15 minutes, or 5 minutes.
The smaller the level, the fewer players can handle it. Generally, 1h-4h is the limit for ordinary players, 5-15 minutes is what professional players can handle, and 1 minute is beyond the control of ordinary professional players.
2. Trading system + must pass. To hone the trading system, long-term trading experience must be accumulated. The sign of successful running-in is not to do anything outside the model, and the conditions are clearly defined. In this process, continuous iteration is required, and the baptism of the mainstream of the bull-bear shock market is required. Because it is leveraged trading, t+0, and frequent trading, 90% of the tuition fees need to be prepared. Many people come up with tens of thousands to play. You must understand one thing. No matter how much starting capital is, it is only enough to pay tuition once, and there are 8 more times to come. Therefore, you must do it with a small amount of capital, hundreds or thousands of dollars, and don’t add funds when you make a profit, and withdraw money when you make a profit. Continue to use small funds. At the beginning, the system and operation will not be particularly proficient, and many mistakes and unnecessary actions cannot be avoided. Many posts say how much they lost. In my opinion, such losses are meaningless. They just paid tuition once, and they didn’t even touch the door. The learning curve has not been raised, which is no different from gambling.
3. Execution must be good. Similar to last year's 519, if you bet on the wrong direction once, you will be doomed. No matter how much money you made before, it will be equal to 0 as long as you don't get through such a black swan. Not to mention strict stop loss, more liquidations are caused by bottom fishing against the trend, similar to the recent luna+ which was also bottom fishing against the trend. Don't bet on low-probability events, and don't expect to achieve success in one battle.
4. Time and experience accumulation. In a bull-bear market, you need to be familiar with the market characteristics of different products at different stages and adjust your strategy according to market conditions.
For small investors, the time they spend in this market is very limited, so it is certainly difficult to get involved in such a professional market. I have a few suggestions.
1. Trial and error with small capital.
2. Keep the leverage below 2/3 times, make good fund planning based on the big cycle, and consider rolling positions.
3. Do large cycles at the 1h, 4h or daily level.
4. If the conditions are insufficient, do not do short-term contract trading unless you are a professional, and do not do it as a professional unless you have no other choice.
5. Without completing the first 4 items, do not invest more than 20,000 yuan. Just use the pocket money you don’t feel bad about losing in the event of a loss.
In fact, in terms of difficulty, contracts are much more cruel in terms of results than arbitrage and spot trading. Don't look at the few people at the top of the pyramid. They are all trying to trick retail investors into entering the market. Everyone knows that the success of a general is the result of the sacrifice of thousands of soldiers.
I hope there will be less tragedy and more rationality. Keep a light position, follow the trend, and stop loss. The above suggestions hope to save your wallet and not fall into the quagmire of the casino and go down a road of no return. With 2,000 yuan in your pocket, why do you have to do contracts? You can only make 20,000 yuan if you make ten times a year. Setting up a stall for a month is not better than this. Many people end up getting stuck in a dead end and have to do it. The opportunity cost is much higher than other ways. Do it according to your ability.
I am Instructor Huang. I have experienced many rounds of bull and bear markets and have rich market experience in many financial fields. Follow the official account (Crypto Instructor Huang). Here, you can penetrate the fog of information and discover the real market. Grasp more opportunities for wealth codes and discover truly valuable opportunities. Don't miss them and regret it!
There are 16 must-read candlestick charts and price patterns that cryptocurrency traders must understand and master. Even cryptocurrency novices can master the K-line immediately. The simpler the truth, the more useful it is.
Pure dry goods sharing
The candlestick chart comes from the 18th century Japanese book "Sakata Strategy", written by Hisamune Honma. The book mainly records the strategies he used in rice market trading. The price diagrams gradually evolved into candlestick lines. Candlestick lines are also called kei lines and yin-yang lines in Japan. Later, they were transliterated into K lines by Westerners, and developed from this.
To draw each daily candlestick, four prices are required: opening price, closing price, highest price and lowest price.
The thin line at the top of the K-line is called the upper shadow line, and the thick line in the middle is the body. The thin line below is the lower shadow line. When the closing price is higher than the opening price, that is, the price trend is rising, we call the K-line in this case a positive line. Generally speaking, the middle body is represented by red. At this time, the length of the upper shadow line represents the price difference between the highest price and the closing price, the length of the body represents the price difference between the closing price and the opening price, and the length of the lower shadow line represents the price difference between the opening price and the lowest price.
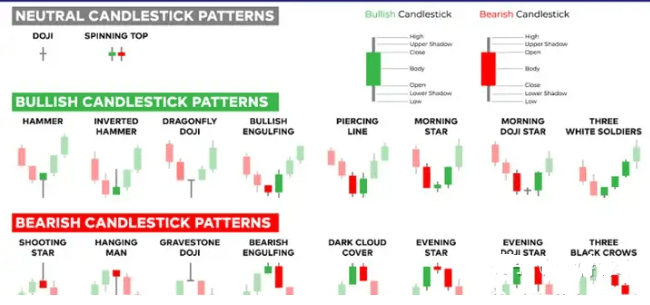
Here are 16 candlestick charts and price patterns you must know for trading:
Candlestick charts are used to predict future price movements. Here are 16 common candlestick charts and how to use them to find trading opportunities.
The candlestick chart itself has three basic features:1. The body of the candlestick, which represents the open/close price range2. The wicks, or shadows, which represent the intraday highs and lows3. The candlestick color reveals the direction of market movement – a green body indicates rising prices, while a red body indicates falling prices
As prices change, the candlesticks form patterns that traders can use to identify major support and resistance levels. There are many candlestick patterns that suggest trading opportunities in the market - a reversal of price movement, a continuation of price movement or market indecision. Before starting to trade, it is important to understand the basics of candlestick charts and how to identify trading opportunities through their patterns, i.e. to provide a basis for trading.
Practice reading candlestick charts: When using any candlestick chart, while candlesticks and price patterns are great for quickly predicting trends, they should also be used in conjunction with other forms of technical analysis to confirm the overall trend.
Six Bullish Candlestick Patterns: Bullish candlestick patterns may form after a downtrend in the market and indicate that the price trend has reversed. They are indicators that traders should consider opening a long position.
Hammer candlestick pattern: The hammer candlestick pattern is formed by a short body and a long lower shadow at the bottom of a downtrend. A hammer shows that despite selling pressure, strong buying power eventually causes prices to recover. The color of the hammer can vary, but a green hammer indicates stronger buying power than a red hammer.
Inverse Hammer Pattern
An equally bullish pattern is the inverted hammer. The only difference is that the upper shadow is very long, while the lower shadow is very short. This shows that buying pressure, followed by selling pressure, was not enough to push the market price down. The inverted hammer pattern shows that buyers will soon take control of the market.
Bullish Engulfing Pattern
The Bullish Engulfing pattern consists of two candlesticks. The first candle is a short red body that is fully engulfed by a larger green candle.
The second day opened lower than the first, but the bullish market pushed prices higher, ultimately attracting more buyers.
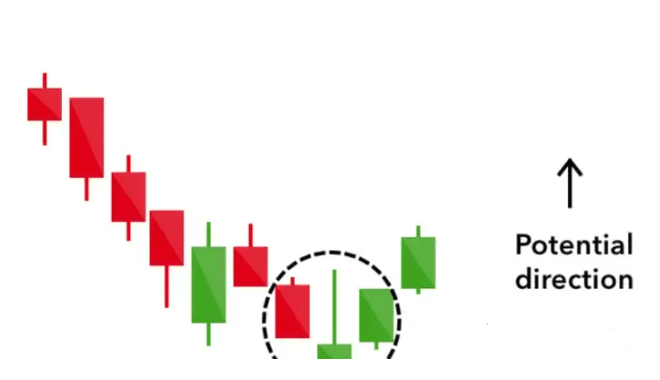
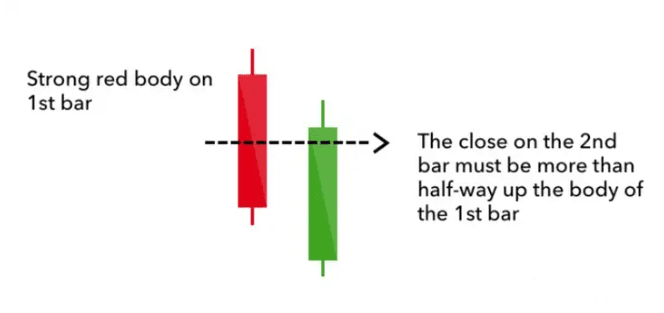
Piercing line
The piercing line is also a two-bar pattern, consisting of a long red candle and a long green candle. Generally speaking, there will be a large gap between the closing price of the first candlestick and the opening price of the green candlestick. Since the price is pulled up to the middle price of the previous day or even higher, it shows that there is a lot of buying pressure.
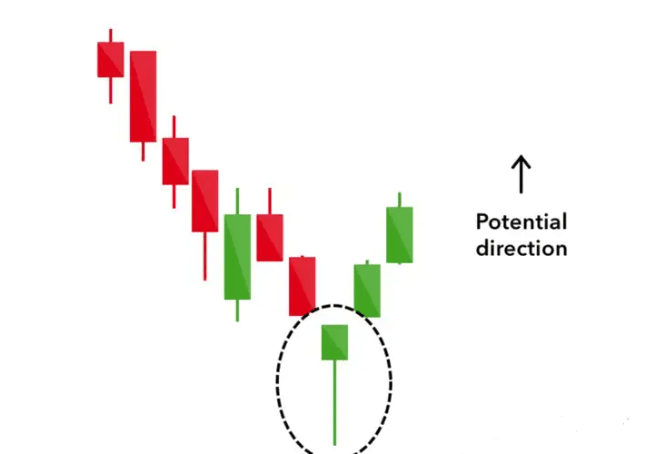
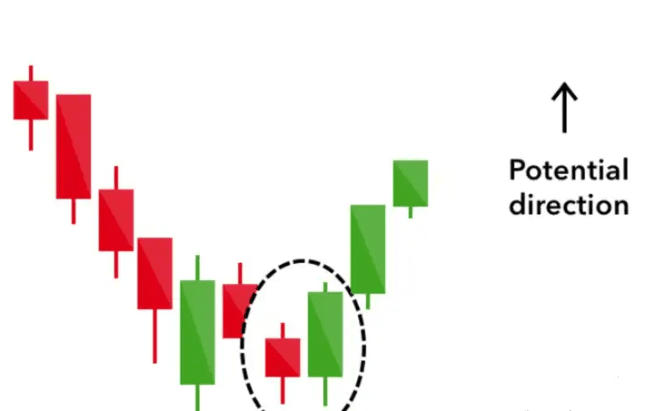
Morning Star
The Morning Star pattern is considered a sign of hope in a downtrend. It consists of three candles: a long candle, between a long red and a long green. Generally, the "star" does not overlap with longer candles because there are market gaps at the opening and closing. This indicates that the selling pressure on the first day is weakening and a bull market is about to begin.
Three White Soldiers
The Three White Soldiers consists of consecutive long green candlesticks (with upper shadows) that open and close progressively higher than the previous day. This is a strong bullish signal, indicating a steady increase in buying pressure after a downtrend.
Six bearish candlestick patterns
Bearish candlestick patterns tend to form after an uptrend and signal a resistance point. Severe pessimism about market prices often leads traders to close their long positions and open a short position to take advantage of falling prices.
The Hanging Man is a bearish pattern, the equivalent of the Hammer. It has the same shape, but forms at the end of an uptrend. This indicates that there was heavy selling, but buyers were able to push prices higher again. Heavy selling is often seen as a sign that bulls are losing control of the market.
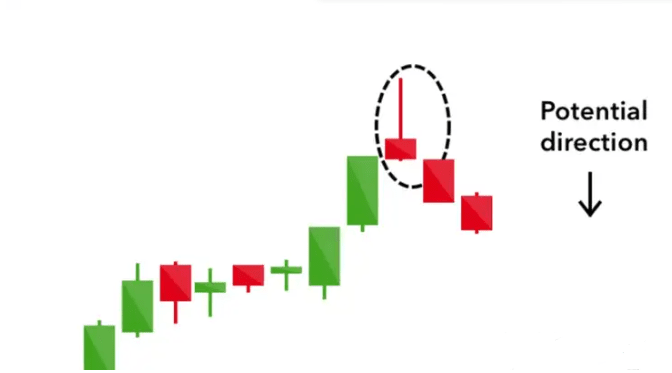
Shooting Star
The shooting star has the same shape as the inverted hammer, but is in an upward trend: it has a small lower body and a long upper shadow. Generally speaking, the market will have a large gap up at the open, then rebound to the intraday high, and then close at a price above the intraday high, just like a star falling to the ground.
Bearish Engulfing Pattern
The Bearish Engulfing pattern occurs at the end of an uptrend. The first candle has a small green body and is subsequently engulfed by a long red candle. This indicates that price action has peaked or slowed down and indicates an upcoming market downturn. The lower the second candle is, the more significant the trend is likely to be.
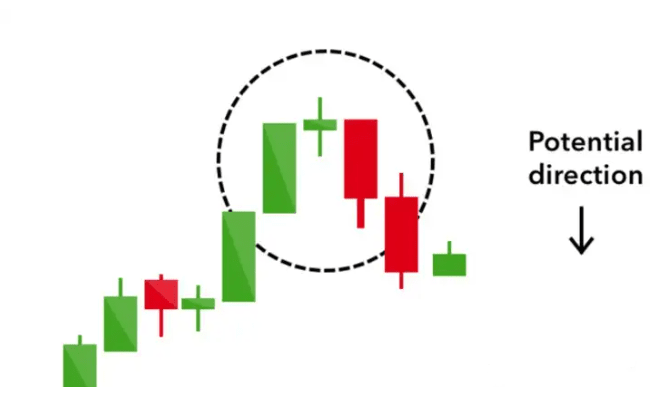
Evening Star
The Evening Star is a three-candle pattern that is the bullish equivalent of the Morning Star. It is formed by a short candle with a long green candle and a large red candle in the middle. The appearance of this pattern often indicates a reversal of the uptrend, and when the close of the third candle is lower than the open of the first candle, it indicates a clear bearish trend.
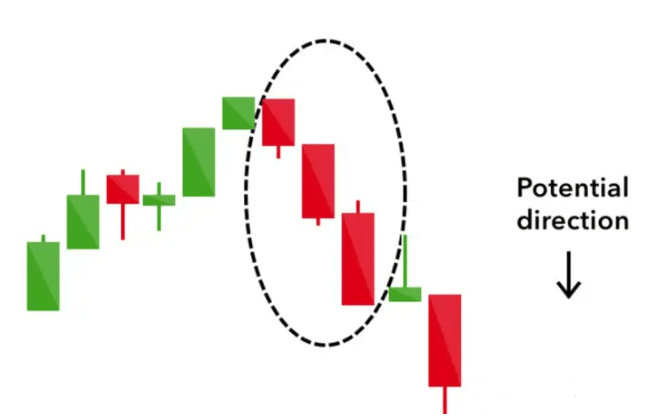
Three black crows
The Three Black Crows pattern consists of three consecutive long red candlesticks with short or non-existent shadows. The opening price is close to the previous candle's opening price, but the closing price keeps falling due to selling pressure. Traders interpret this pattern as the beginning of a downtrend because sellers have outstripped buyers for three consecutive trading days.
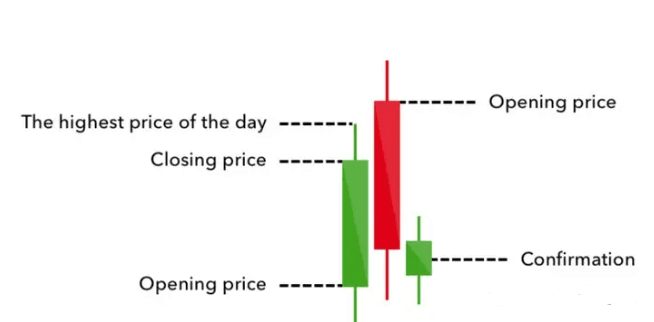
Dark Cloud Cover
The dark cloud pattern indicates a bearish reversal. It consists of two candles: a red candlestick that gaps up above the previous green body and closes at the midpoint. This indicates that the bears have taken over the intraday trading, causing the price to fall sharply. If the candle has a short shadow, it means that the downtrend is decisive.
Four Continuation Candlestick Patterns
If the candlestick patterns do not indicate a change in the market trend, we call them continuation patterns. These can help traders identify breaks in the market when the market is indecisive.
Doji (DOJI) When the market opens and closes very close to each other, the candlestick pattern resembles a cross or plus sign. This type of doji pattern illustrates a struggle between long and short parties, leaving neither side with any advantage. A single doji pattern is a neutral signal, but can be found in trend reversal patterns, such as the bullish morning star and the bearish evening star.
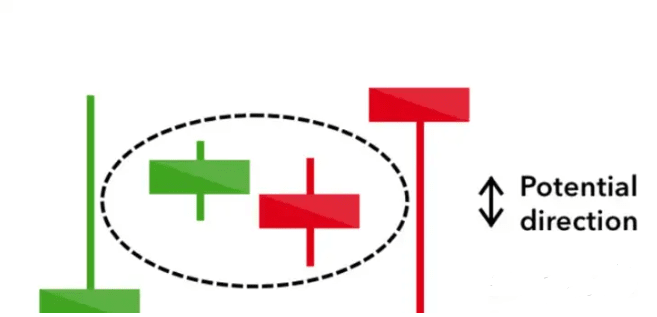
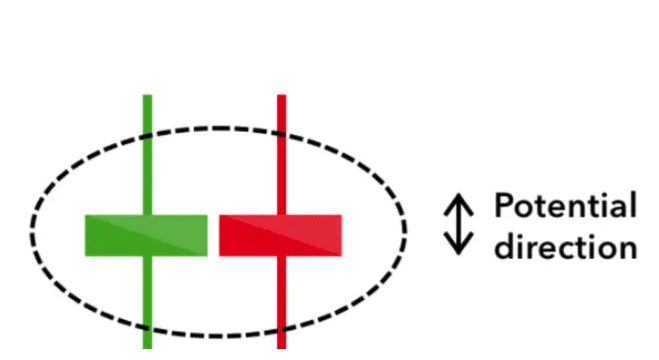
Spinning Top
The Spinning Top candlestick pattern has a short body that is halfway between the upper and lower shadows. This pattern indicates that the market is indecisive and that the price is not moving too much: the bulls push the price higher, while the bears push it lower again. The Spinning Top pattern is generally interpreted as a continuation pattern of an uptrend or a downtrend. On their own, the tops of a spinning top are a relatively mild signal, but they can be interpreted as a sign of things to come, as it indicates that the current market pressure is getting out of control.
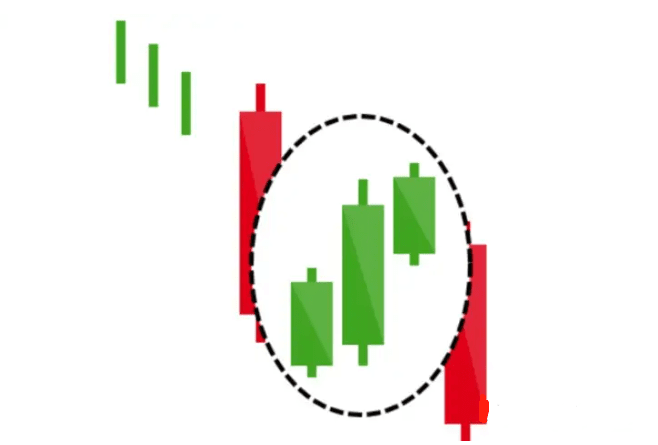
Falling Three Methods
The method of three patterns is used to predict the continuation of the current trend, whether bearish or bullish. The bearish pattern is called the method of three below. It consists of a long red candle followed by three small green candles and another red candle – the green candles are all contained within the range of the bearish candle. It will tell traders that the bulls are not strong enough to reverse the trend.
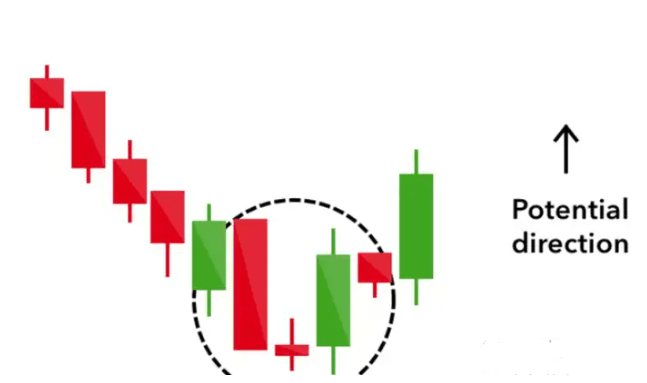
Rising three methods
For a bullish pattern, a candlestick pattern called the "Upper Three Method" does the opposite. It consists of three short reds sandwiched within two long greens. What this pattern conveys to traders is that despite some selling pressure, buyers are still in control of the market.
The candlestick chart shows how market prices change over a specific period of time and is an important tool for entering the cryptocurrency trading world. Here are some basic guidelines to help you understand the candlestick chart.
1. Bullish candlestick chart pattern
1. Hammer Hammer is located at the bottom of a downtrend with a long lower shadow, at least twice the length of the candle body. It indicates that despite the strong selling pressure, buyers pushed the price up close to the opening level. A green hammer is more strongly bullish than a red one.
2. Inverted Hammer The inverted hammer pattern is similar to the hammer pattern, but the long shadow is above the body. It usually appears at the bottom of a downtrend, indicating upside potential. Even if the sellers pull it down to the opening level, the price does not continue to fall, indicating that the market may turn bullish.
3. Three White Soldiers The Three White Soldiers pattern consists of three consecutive green candlesticks that open within the body of the previous candlestick and close above the previous candlestick's high. The lower shadow is short, indicating continued buying pressure.
4. Bullish Harami The bullish harami consists of a long red candle followed by a shorter green candle, with the green candle completely within the body of the red candle, indicating that the bearish trend is slowing down or is about to end.
2. Bearish candlestick chart pattern
1. Hanging line
A hanging man is similar to a hammer but occurs at the end of an uptrend, indicating that while buyers are pushing prices higher, a massive sell-off suggests the market may soon turn bearish.
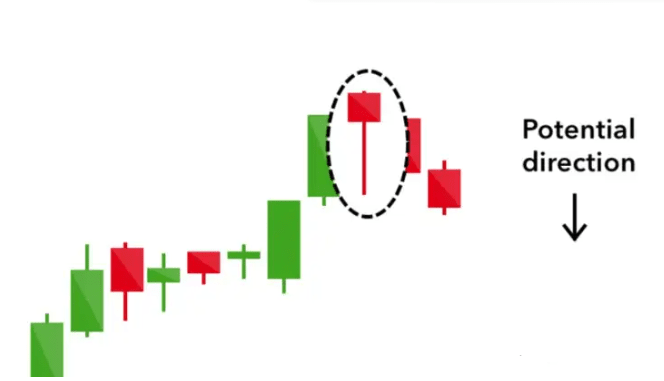
2. Shooting Star Line
A shooting star is a candle with a long upper shadow and a short body close to the bottom. It usually appears at the end of an uptrend, indicating that after the market reached a high, sellers led the price to fall back.
3. Three Crows
Three Black Crows consists of three consecutive red candlesticks that open within the body of the previous candlestick and close below the previous candlestick's low, indicating that selling pressure continues to push prices down.
4. Bearish Harami
The bearish harami consists of a long green candlestick followed by a shorter red candlestick, with the red candlestick completely within the body of the green candlestick, indicating that buying pressure is waning.
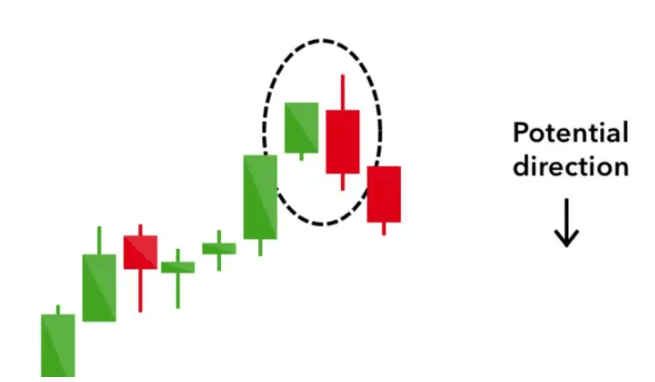
5. Dark clouds cover the sky
A dark cloud cover consists of a green candlestick followed by a red candlestick, where the red candlestick opens above the close of the previous green candlestick but closes below the midpoint of the green candlestick, usually on high volume, indicating a turn from an uptrend to a downtrend.
3. Three types of K-line chart patterns
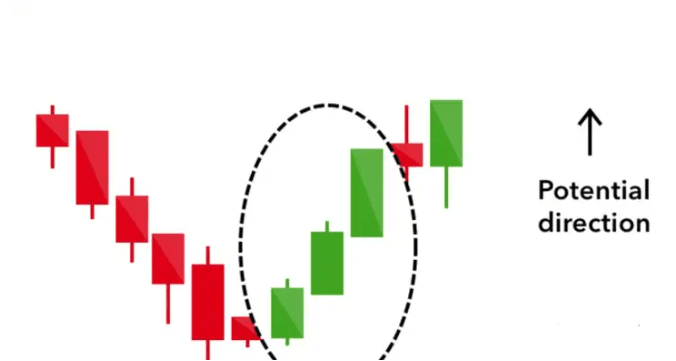
1. Three rising methods
The rising three-way pattern is common in an uptrend. It consists of three shorter red candlesticks followed by a rising green candlestick, indicating that the market will be bullish again. This pattern indicates that the market will continue to rise after a short adjustment and is a buy signal.
2. Three methods of decline
The opposite of the ascending three methods, the descending three methods pattern indicates that the market will continue to fall. This pattern consists of three shorter green candlesticks followed by a falling red candlestick, indicating that the market will continue to fall after a short correction, which is a sell signal.
3. Doji
A doji pattern is formed when the opening and closing prices are the same or very close, indicating an undecided balance of power between buyers and sellers. Doji can be divided into the following categories:
Gravestone Doji: Signals a bearish reversal, with a long upper shadow and open/close prices close to the lowest low.
Long-legged Doji: indicates an unresolved situation, with upper and lower shadows, and the opening/closing prices are near the midpoint of the candle body.
Dragonfly Doji: indicates a bullish or bearish market, with a long lower shadow and the opening/closing price is close to the highest point.
4. How to use K-line charts in Bitcoin trading
1. Learn the basics
Cryptocurrency traders should learn the basics of candlestick charts, including how to read candlestick charts and identify different candlestick chart patterns. Understanding different candlestick chart patterns and their meanings is the basis for technical analysis.
2. Combine multiple indicators
Use candlestick patterns in conjunction with other technical indicators, such as moving averages, the relative strength index (RSI) and the exponential moving average convergence (MACD), to get a more comprehensive forecast. The combined use of multiple technical indicators can improve the accuracy of the forecast.
3. Choose multiple time ranges
Analyze candlestick patterns in multiple time frames to get a comprehensive understanding of market sentiment. For example, when analyzing the daily chart, you should also pay attention to the hourly and 15-minute charts. Analyzing multiple time frames can help traders better grasp the short-term and long-term trends of the market.
4. Practice risk management techniques
Using candlestick chart patterns involves risks, and traders should practice risk management techniques, such as setting stop-loss orders to protect funds and avoid over-trading. Reasonable risk management can help traders reduce losses and increase the success rate of transactions.
The candlestick chart pattern is a way to observe market trends and help traders identify potential opportunities. It is analyzed by combining the market environment and technical analysis indicators such as trend lines, RSI, stochastic relative strength index, Ichimoku cloud and parabolic indicators. Support and resistance levels are also important components of candlestick chart analysis. Support refers to the price level where strong demand is expected, and resistance refers to the price level where strong supply is expected.
5. Practical skills
1. Trend confirmation
Use candlestick chart patterns to confirm market trends. For example, the appearance of three white soldiers can confirm an upward trend, while the three crows can confirm a downward trend. Trend confirmation is an important step in developing a trading strategy.
2. Combined with trading volume
Analyze candlestick patterns in conjunction with volume. Changes in volume can provide additional information about market sentiment. For example, in an ascending three-method pattern, if volume increases with each green candlestick, it indicates strong buying sentiment.
3. Backtesting strategy
Before applying the candlestick chart pattern in real trading, you can backtest the trading strategy through historical data. Through backtesting, you can evaluate the effectiveness and stability of the strategy, thereby improving the success rate of trading.
4. Maintain discipline
During the trading process, strictly follow the established strategies and risk management measures. Avoid emotional trading. Staying calm and disciplined is an important factor in successful trading.
Through in-depth learning and practice, beginners can gradually master the analysis skills of Bitcoin K-line charts and improve their decision-making ability and profitability in cryptocurrency transactions.
There are several points you must know about contracts in the cryptocurrency world:
What is leverage trading?
Before introducing isolated margin and cross margin, let's briefly introduce leveraged trading. Leveraged trading refers to investors using funds borrowed from trading platforms or brokers to buy and sell assets beyond their own ability to bear. They use their own assets in the account as collateral to borrow and invest more funds in the hope of earning more returns.
Suppose you have $5,000 and believe the price of Bitcoin will rise. You can buy $5,000 of Bitcoin directly or trade with borrowed funds using your own position. Suppose the price of Bitcoin rises by 20%. If you invested $5,000 without using leverage, the value of your current investment would rise to $6,000 ($5,000 principal + $1,000 profit). In other words, the profit is 20% of the principal.
However, if you use a 5:1 leverage when investing $5,000, you will borrow four times your own funds, which means you will have an investment capital of $25,000 ($5,000 is your own funds and $20,000 is the loan). Assuming the price of Bitcoin increases by 20%, the value of your $25,000 investment capital will now rise to $30,000 ($25,000 investment capital + $5,000 profit). When you repay the $20,000 loan, you will have $10,000 left. In other words, the profit is 100% of your own funds ($5,000).
Remember that leveraged trading is extremely risky. Let's look at the opposite scenario, where the price of Bitcoin drops by 20%. At this point, if you had not used leverage, the value of your $5,000 investment would drop to $4,000 ($5,000 investment - $1,000 loss), a 20% loss. But if you used 5:1 leverage, the value of your $25,000 investment would drop to $20,000 ($25,000 investment - $5,000 loss). Once you repay your $20,000 loan, you will be left with nothing, a 100% loss.
The simplified examples above do not include transaction fees or possible interest on borrowed funds, which can reduce your returns in real trading scenarios. It is important to remember that because markets can move quickly, potential losses could even exceed your investment principal.
What is Isolated Margin?
Isolated margin and cross margin are two different types of margin that are offered by many cryptocurrency trading platforms. Both models have their own benefits and risks. Below we will take a closer look at what these two models are and how they work.
In isolated margin mode, the margin amount for a specific position is limited. This means that users can decide how much funds to allocate as collateral for a specific position, while the remaining funds are not affected by the transaction.
Assume that your total account balance is 10 BTC. You believe that the price of Ethereum (ETH) will rise, so you decide to open a leveraged long position on ETH. You allocate 2 BTC as isolated margin for this particular trade, with a leverage ratio of 5:1. This means that you are actually trading 10 BTC worth of ETH (2 BTC of your own funds + 8 BTC leveraged position).
If the price of ETH rises and you decide to close your position, all the profits you make will be credited to the initial margin of 2 BTC allocated to the trade. But if the price of ETH drops sharply, the maximum amount you can lose is the isolated margin of 2 BTC. Even if your position is forced to be closed, the remaining 8 BTC in your account will not be affected. This is why this mode is named "isolated" margin.
What is Cross Margin?
Cross margin uses all available funds in your account as collateral for all trades. If one position is losing money, but another is profitable, that profit can be used to cover the loss, allowing you to hold your position longer.
Let's use an example to explain how this works. Let's assume that your total account balance is 10 BTC. You decide to open a leveraged long position in ETH and a leveraged short position in another cryptocurrency, Z, in Cross Margin mode. You are actually trading 4 BTC worth of ETH and 6 BTC worth of Z, both with a leverage ratio of 2:1. Your total account balance of 10 BTC will be used as collateral for both positions.
Assume that the price of ETH falls, causing potential losses, but at the same time the price of Z also falls, resulting in a profit on your short position. In this way, the profit from the Z transaction can be used to offset the loss from the ETH transaction, and both positions can remain open.
However, if the price of ETH falls and the price of Z rises, both of your positions could face losses. If the loss exceeds your total account balance, both positions could be forced to close and you could lose your entire 10 BTC account balance. This is very different from isolated margin, where your maximum loss is no more than the 2 BTC allocated to the corresponding trade.
Keep in mind that the above simplified examples do not include transaction fees and other costs. In addition, real trading scenarios are usually much more complicated.
The main difference between isolated margin and cross margin
From the above examples, we can clearly see the similarities and differences between isolated margin trading and cross margin trading. We can summarize their main differences in the following way:
Collateral and Liquidation Mechanism
In isolated margin mode, only a portion of funds is reserved for a specific trade, and only that portion of funds is at risk of loss. This means that if you use 2 BTC to trade in isolated margin mode, only these 2 BTC are at risk of forced liquidation.
However, in the cross margin model, all the funds in your account are used as collateral for the trade. If a position is losing, the system can use your entire account balance to prevent the position from being forced to close. However, if multiple trades are losing heavily, you may lose your entire balance.
Risk Management
Isolated margin allows for more granular risk management. You can allocate a specific amount you are willing to lose to each trade without affecting the remaining account balance. In contrast, cross margin combines the risk of all open positions. This model can be useful when managing multiple positions that may offset each other, but combining the risk of all positions may also mean that potential losses may be higher.
flexibility
In isolated margin trading, if you want to increase your margin, you must manually add more funds to the isolated margin position. In contrast, cross margin automatically utilizes all available balances in your account, preventing any positions from being forced to close, eliminating the need to frequently pay maintenance margin.
Use Cases
Isolated margin is suitable for traders who want to manage risk on a trade-by-trade basis, especially when the trader is highly confident in a particular trade and wants to manage the risk separately. Cross margin is more suitable for traders who hold multiple positions that may hedge each other, or those who want to utilize their entire account balance without having to pay maintenance margin frequently.
Advantages and Disadvantages of Isolated Margin
The advantages and disadvantages of isolated margin are as follows:
Advantages of Isolated Margin
Manageable risk: You decide how much money to allocate and lose on a specific position. Only that amount of money is at risk of loss, and the remaining funds in your account are not affected by the potential loss of that specific trade.
Clearer P&L: When you know the exact amount of money allocated to a single position, it is easier to calculate the P&L of that position.
Predictability: By segregating funds, traders can predict the maximum loss they could face in a worst-case scenario, which helps in better risk management.
Disadvantages of Isolated Margin
Requires close monitoring: Since only a portion of your funds are used as collateral for your position, you may need to monitor your trades more closely to avoid forced liquidations.
Limited leverage: If a trade starts losing money and is close to being liquidated, you cannot automatically use your remaining account funds to stop it. You must manually add more funds to your isolated margin.
Higher management costs: Juggling multiple isolated margins for different trades can be complex, especially for beginners or traders managing a large number of positions.
In summary, while isolated margin provides a controlled environment for managing leveraged trading risks, the model requires more active management and may limit profit potential if used improperly.
Advantages and Disadvantages of Isolated Margin
The advantages and disadvantages of cross margin are as follows:
Advantages of Cross Margin
More flexible margin allocation: Cross margin automatically uses all available balance in the account to avoid forced liquidation of any open positions. Compared with isolated margin, this model provides higher liquidity.
Offsetting positions: Gains and losses between positions can offset each other, which may be beneficial for hedging strategies.
Reduced Liquidation Risk: Cross Margin reduces the risk of any single position being liquidated prematurely by pooling all balances, as there is a larger pool of funds to meet margin requirements.
Easily manage multiple trades: This simplifies the process of managing multiple trades simultaneously, as you don’t have to adjust margin for each trade individually.
Disadvantages of Cross Margin
Higher risk of overall liquidation: If all positions incur losses and the total loss exceeds the total account balance, there is a risk of losing the entire account balance.
Less control over individual trades: In the cross margin model, since the margin is shared by all trades, it is difficult to set a specific risk-reward ratio for a single trade.
Potential for over-leverage: Since the cross margin model allows the use of the entire balance, traders may be tempted to open larger positions than in the isolated margin model, which may result in larger losses.
Lack of clarity on risk exposure: It is difficult for traders to clearly gauge their overall risk exposure, especially when there are multiple open positions with varying degrees of profit and loss.
An example of using both isolated margin and cross margin
Combining isolated and cross margin strategies is a subtle way to maximize returns and minimize risk in cryptocurrency trading. Let’s use an example to illustrate how it works.
Let's assume that you think the price of ETH will rise due to an upcoming upgrade to Ethereum, but you also want to hedge against potential risk from overall market volatility. You suspect that while ETH may rise, BTC may fall.
In this case, you can consider using isolated margin mode for a portion of the portfolio (for example, 30%), and use that portion of funds to open a leveraged long position in ETH. This way, you can limit your potential losses to 30% in case ETH does not perform as expected. But if the price of ETH rises, you will get a substantial gain from this portion of the portfolio.
For the remaining 70% of the portfolio, you use the cross margin model to open a short position in BTC and a long position in another altcoin, Z. You believe that this trade will perform well regardless of BTC's trend.
In this way, you are using the potential gains of one position to offset the potential losses of another position. If BTC drops as you predicted, the resulting gains can be used to offset the losses of Z, and vice versa.
Once you have these positions set up, you will want to monitor both strategies on an ongoing basis. If ETH starts to drop, you may want to consider reducing your isolated margin position to limit your losses. Similarly, if Z in the cross margin strategy starts to significantly underperform, you may also want to consider adjusting your position.
By combining isolated and cross margin, you can actively try to profit from market predictions while also hedging your risk. However, while combining these two strategies can help with risk management, it does not guarantee a profit or avoid losses.
Conclusion
Leveraged trading has the potential to increase returns, but it also comes with equal or even higher levels of risk. Users should choose between isolated margin and cross margin based on their own trading strategy, risk tolerance, and ideal position management level.
Volatility is often a top priority in cryptocurrency trading, so it is important to understand the intricacies of both margin types. Traders can easily navigate the volatility of the cryptocurrency market by combining smart decision-making with diligent risk management practices. Again, be sure to conduct comprehensive research and consult with a professional if possible before diving into leveraged trading.
The above is the trading experience that Brother Liang shared with you today. Many times, you lose a lot of opportunities to make money because of your doubts. You dare not try, contact, and understand boldly. How can you know the pros and cons? Only when you take the first step, you will know how to take the next step. A cup of warm tea, a suggestion, I am both a teacher and a friend who is good at talking to you.
Meeting is fate, knowing each other is destiny. Liang Ge firmly believes that if we are destined to meet, we will meet each other even if we are thousands of miles apart, but if we are not destined to meet each other, it is fate. The road of investment is long, and the temporary gains and losses are just the tip of the iceberg. You must know that a wise man will make a mistake, and a fool will make a gain. No matter how you feel, time will not stop because of you. Pick up the boredom in your heart, stand up again and get ready to move forward.
I am Liang Ge. I have experienced many rounds of bull and bear markets and have rich market experience in many financial fields. Follow Liang Ge, and here, you can penetrate the fog of information and discover the real market. Grasp more opportunities for wealth codes, discover truly valuable opportunities, and don't miss them and regret it!
It is better to teach a man how to fish than to give him a fish. Whether you are a novice or an expert in the cryptocurrency circle, you will not only gain financial benefits from Brother Liang, but also grow in investment knowledge and experience. In the process of following Brother Liang's investment, Brother Liang will not only provide investors with market analysis ideas, basic knowledge of market reading, and methods of using various investment tools, but also bring you wonderful fundamental interpretations, sorting out the chaotic international situation, and identification of various investment forces. Let you become both a winner and an expert in investment!
To navigate the cryptocurrency market, you must master the seven major trading methods and be well versed in the investment’s advances, retreats, offenses and defenses, so that you can be as stable as a rock in the face of a storm and turn danger into safety in the face of a trap. Brother Liang has been in the market for many years and is well aware of the opportunities and traps. If your investment is not going well and you are unwilling to lose money, you can contact Brother Liang and I will correct your past; if you are profitable now, I will teach you how to maintain your profit; if you are still lonely and confused in the market, Brother Liang is willing to guide you forward. The real tragedy of trading is not how much you suffer, but how many opportunities you miss! Seize the present and move forward hand in hand. I am Brother Liang, a person who will leave his name in the cryptocurrency circle in the future#币安HODLer空投ERA #山寨币突破 $BTC


