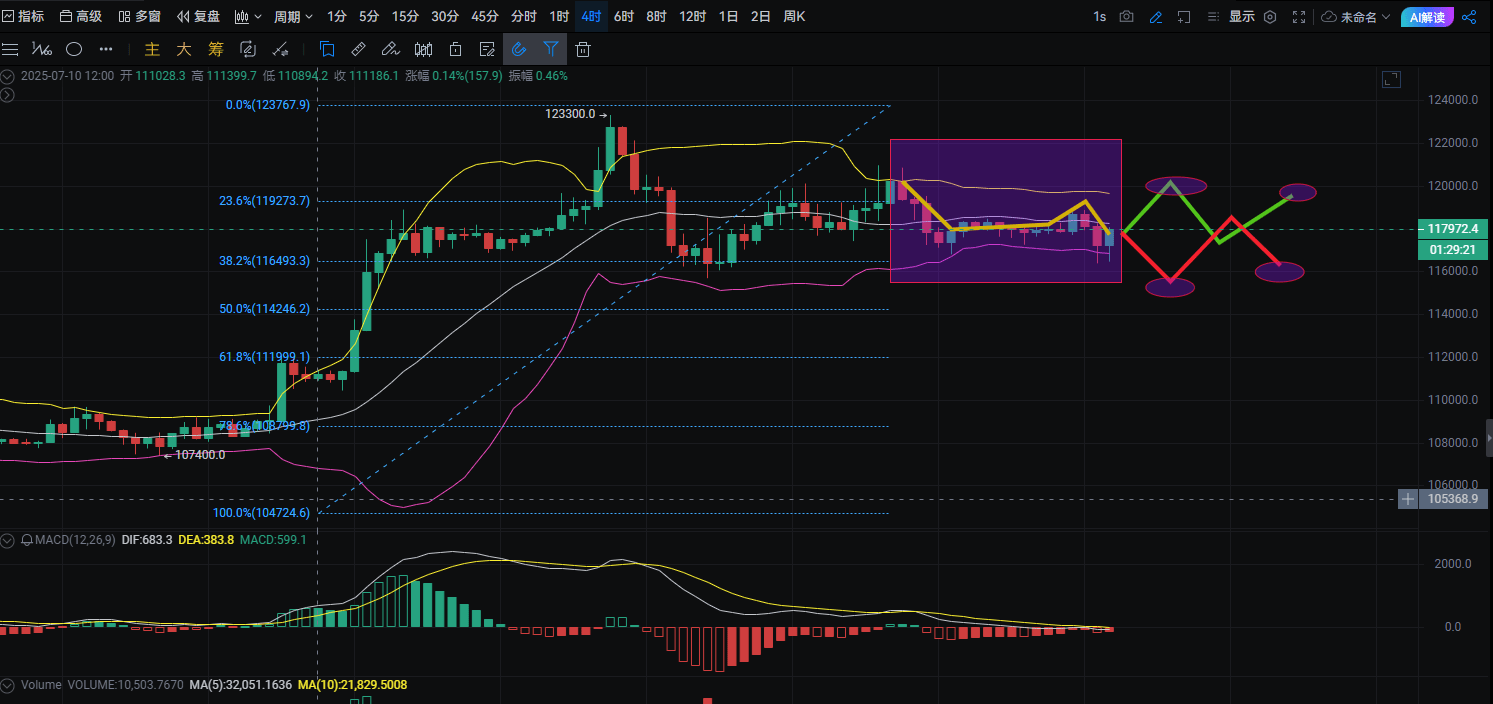
At 4 AM, BTC closed with a bearish candle around $116,699, with trading volume significantly increased compared to the previous 4 hours. Bears interpret through action: during the consolidation phase, every rise is a test of the market. But don't panic, the technicals hide mysteries: although the MACD histogram is green, it hasn't made a new low, and after the KDJ death cross, the K value is stuck at 76, the 'bull-bear dividing line,' reminiscent of the accumulation signal before ETH broke through $2,000 in September 2023.
Three major variables in the news:
Institutional 'sneaky moves': CoinShares data shows that recent net inflows into BTC funds exceeded $1 billion, with over 60% coming from traditional hedge funds. These 'large funds' specifically target volatile markets for positioning. Policy 'combination punches' are landing: New UK FCA stablecoin regulations + the advancement of the US GENIUS Act, equivalent to equipping BTC with a 'compliance engine,' which could challenge gold's reserve status in the long run. The Federal Reserve becomes the 'key player': Before the July 31 interest rate decision, the market has bet on 'keeping interest rates unchanged', but if Powell releases a 'dovish' signal, BTC may break through the $120,000 mark.
Three core technical signals:
Moving averages intertwine to form a 'pre-reversal signal': Price is stuck in the dense zone of the MA20-MA200 moving averages at $116,929 - $119,741. This kind of 'narrow range shake' often indicates a directional choice. Historical data shows that BTC oscillated in a similar range for 12 days before breaking through $60,000 in October 2021. The volume-price relationship shows 'decay signals': During yesterday's decline, selling pressure increased, but compared to the sharp drop on July 18, the current selling pressure intensity has weakened by about 30%, suggesting a decline in bearish strength, and smart money may have adjusted positions. The indicator group 'hides breakthrough opportunities': The MACD histogram remains negative but the DIF line is flattening, and the Bollinger Bands have narrowed to the $115,000 - $122,000 range. This pattern historically has over a 70% probability of triggering a unilateral trend, with key emphasis on trading volume.
Personal opinion: The current market situation is highly similar to the period before BTC broke through in May 2021, with institutions quietly building positions, policy expectations heating up, and technicals aiming to rise after suppression. Those fixated on the 'Tesla selling BTC' news to go short may have forgotten the classic case where BTC surged over 35% after Musk strongly supported Dogecoin in May 2021.
If you're unclear about the actual levels or effective breakthroughs, you can follow me.
#MichaelSaylor暗示增持BTC
Still the same saying: The market is never short of opportunities, what is lacking is the ability to see through the tricks. Follow me, top-tier team support, only serving ambitious madmen.
