Trump's tariff hammer strikes the EU, yet ETH breaks through $3600 against the trend! Is there a hidden surge secret in the technicals?
The global trade war reignites, as Trump wields the "tariff hammer" against the EU, unexpectedly igniting the undercurrents of the crypto market! On July 19, President Trump announced that tariffs on EU goods would increase to 15%-20%, and this news acted like a deep-water bomb, instantly detonating the global financial market. However, while the traditional stock market is in despair, Ethereum (ETH) quietly emerges with independent momentum—breaking through the key level of $3600 on the daily chart, with the technicals releasing a strong bullish signal!
I. Why did the crypto market experience an "anti-common sense" surge with Trump's tariff escalation?
According to the latest news from Jin Shi Data, Trump not only rejected the EU's proposal to lower car tariffs but also threatened to set reciprocal tariffs at over 10%. This policy directly led to a 0.94% drop in the Dow Jones index in a single day, while the euro to dollar exchange rate hit a two-year low. Strangely, the cryptocurrency market shows a "tale of two cities":
Bitcoin: Repeatedly oscillating around the $116,000 mark, with both bulls and bears engaging in a "million-level" leverage showdown in the $116,000-$118,000 range;
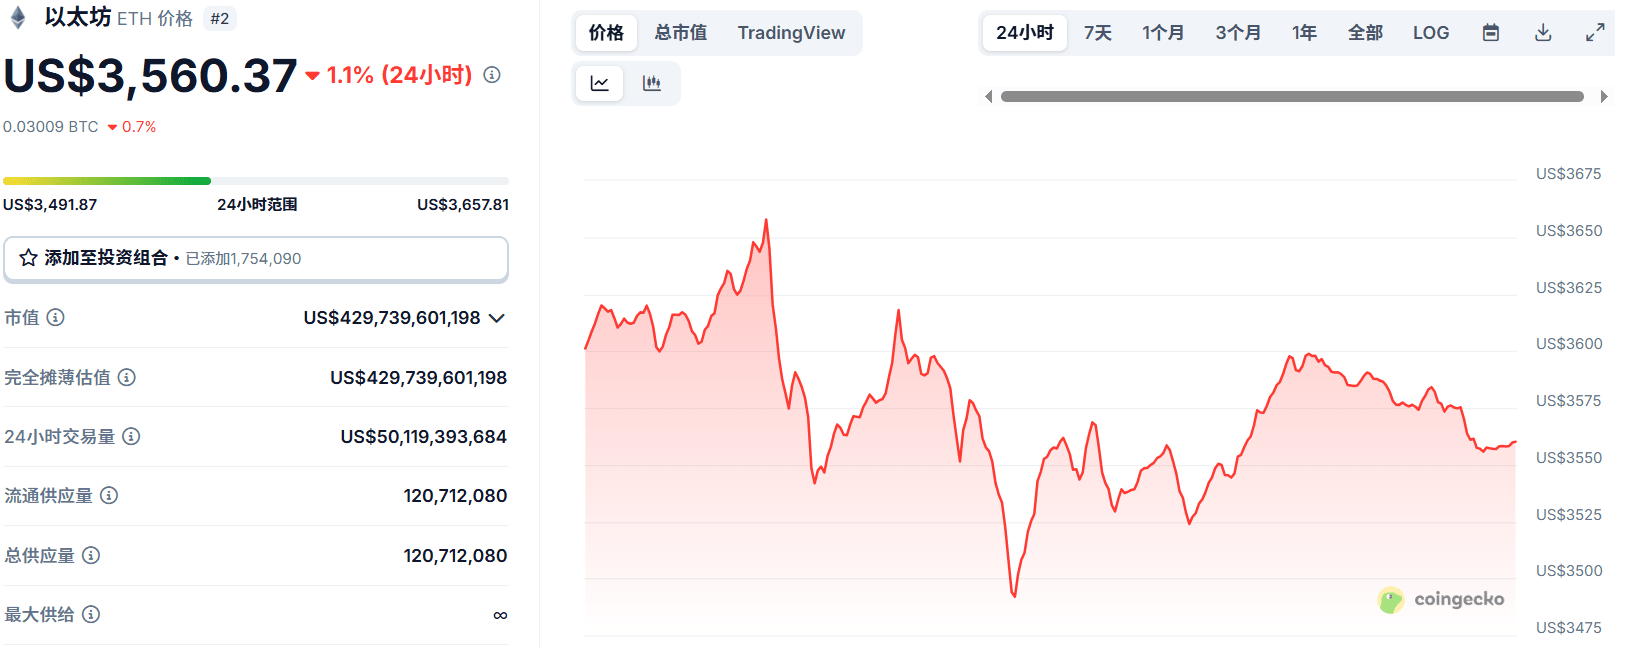
Ethereum: Daily level breaks through the $3674 resistance level, forming a "double bottom reversal" in the technicals, with 24-hour trading volume surging to $48.1 billion!
Revealing the logic behind it:
Safe-haven funds flow in: The global tariff war leads to increased uncertainty in traditional financial markets, prompting some institutional funds to view ETH as "digital gold" for hedging;
Catalyst of technology upgrade: After the Ethereum Dencun upgrade, staking yields exceed 5%, combined with continuous inflow of ETF funds, forming fundamental support;
Whale movements amplify the situation: The "$400 million ETH whale" that has been dormant for 6 years suddenly awakens, briefly triggering a flash crash, but was subsequently bought back by bulls, increasing market confidence!
II. In-depth analysis of candlestick charts: Is ETH at $3600 a "false breakout" or a "new starting point"?
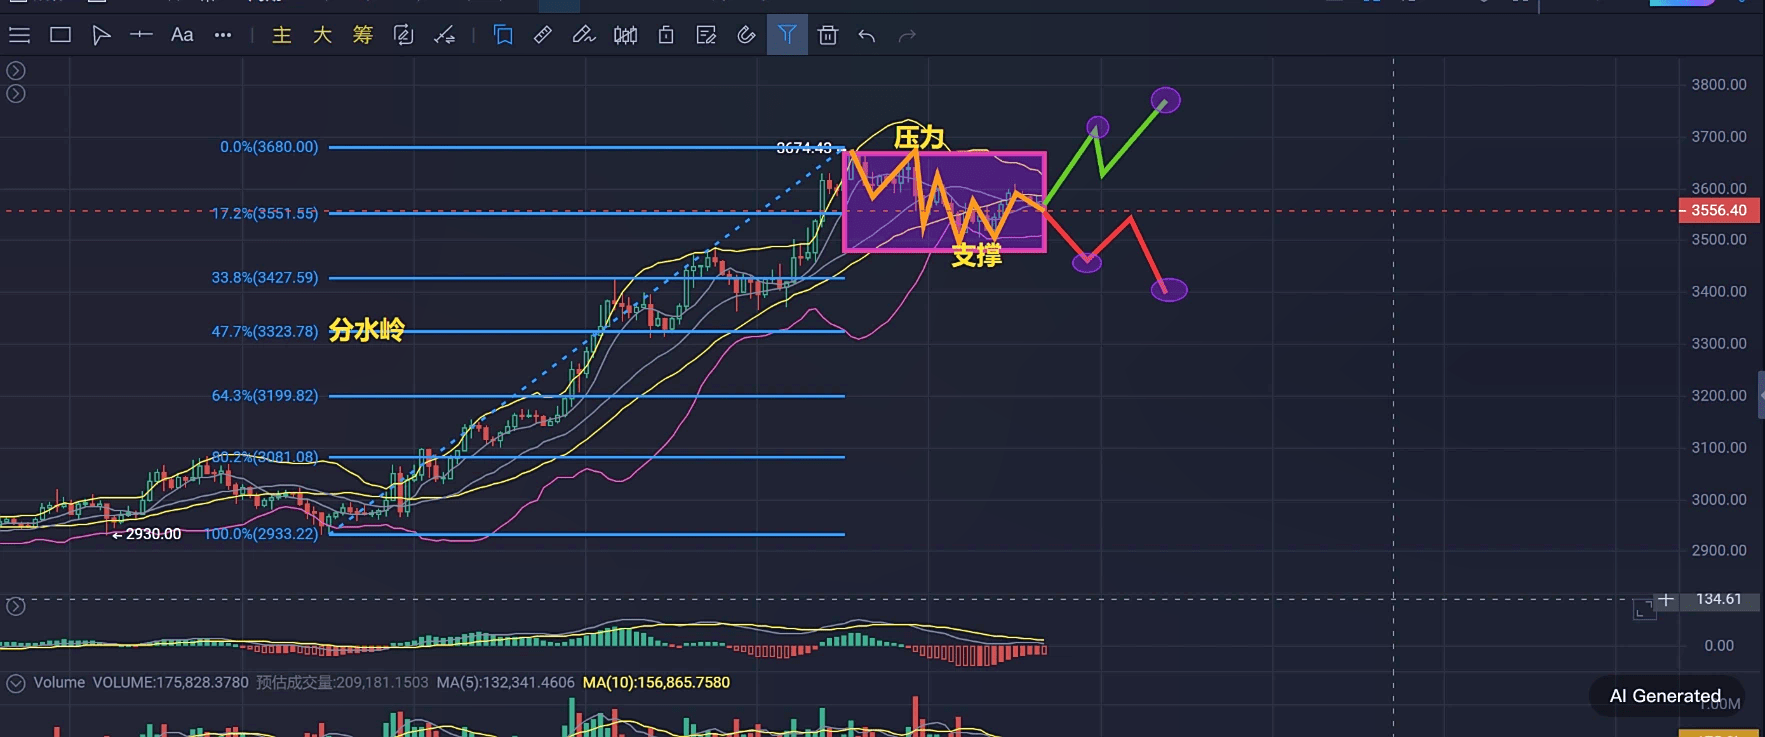
According to the latest ETH daily chart, the current market shows three core characteristics:
Trendline: Price breaks through the downward channel since December 2024, forming an "ascending triangle" structure, targeting a price of $4000;
Key price levels:
Resistance level: $3674 (connecting the historical highs of 2025)
Support level: $3323 (purple box area, the last line of defense for bulls)
Watershed: $3533 (the starting point of a 24-hour volatility of 5.58%)
Technical indicators:
MACD: The histogram continues to shorten, indicating weakening bullish strength, but the golden cross above the zero line remains unbroken;
KDJ: A golden cross forms in the overbought zone (91), beware of a pullback after a rise;
RSI: The value of 70 enters the warning zone, but no top divergence is observed.
III. Debate among crypto elites: Are Trump's tariffs "poison" or "aphrodisiac"?
Bullish camp (Standard Chartered): Bitcoin may surge to $150,000 by year-end, with Ethereum following closely, as the tariff war accelerates fiat currency depreciation, highlighting its hard currency attributes;
Bearish camp (Goldman Sachs): Collapse of non-US demand may trigger a mid-term turning point for copper prices, affecting blockchain mining stocks, with ETH facing rising cost pressures;
Practical camp (AguilaTrades): Opened a $140 million ETH short position with 15x leverage, pricing at $3987, betting on a "policy black swan."
Jin Zhu's perspective: Trump's tariffs are essentially a negotiation strategy of "America First," creating short-term volatility while accelerating global de-dollarization in the long run.
Currently in the "upward continuation" phase, if it stabilizes above $3533 within 3 days, a target of $4000 is possible; if it breaks below $3423, the probability of a pullback to $3000 increases.
From 1 PM yesterday to 4 PM today, it has been oscillating within the box, with strong support at the lower Bollinger band of 3476, which has not broken below the box. After a period of consolidation, Jin Zhu predicts that ETH will break through the top of the box, and specific resistance levels can be observed in the Jin Zhu trend overview!
Follow Jin Zhu, strike accurately, and dominate the waves! The Jin Zhu team lays out in private, guiding you to capture the market starting point with low-leverage contracts, starting the asset doubling engine!#加密立法新纪元 #特朗普施压鲍威尔