

AUDT/USDT: Chart Analysis 🚀
It seems that after a significant decline in early June 📉, AUDT has found its support and has begun a solid recovery! 💪
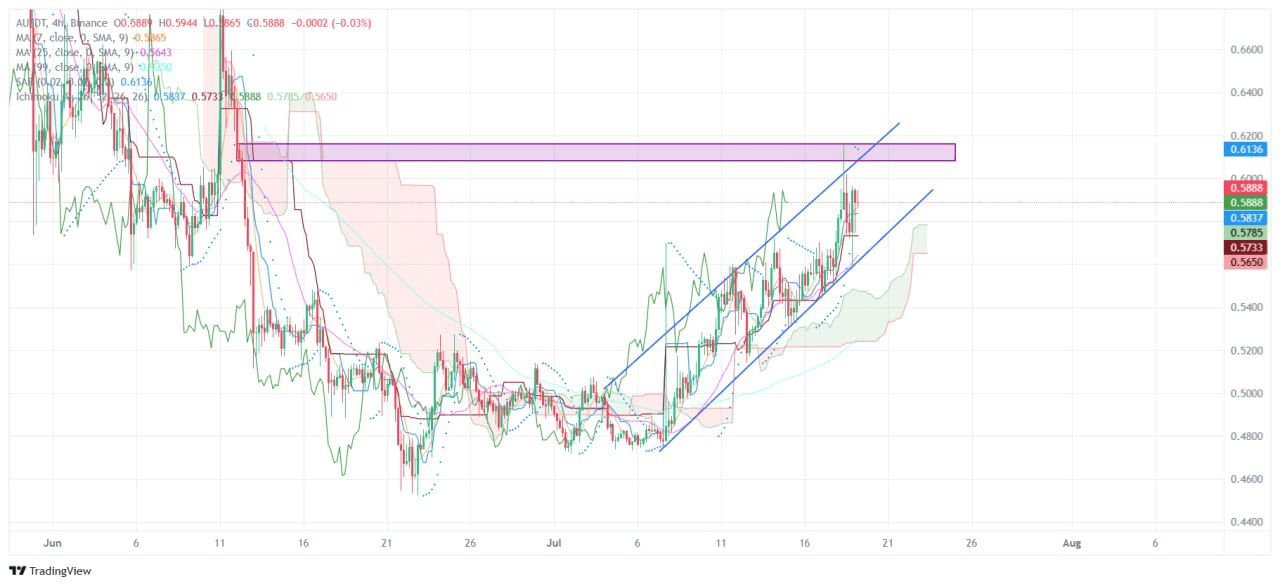
Since the end of June, we have seen a clear ascending channel 📈, which is a great sign for the bulls! The price is confidently moving upward, respecting the boundaries of this channel. It seems that buyers are gaining strength! 🐂
However, there is an important resistance zone around $0.61 - $0.62 ⛔️.
The price has already tried to break through it, but so far unsuccessfully. This is a key level that needs to be overcome for further growth! 🔑
The Ichimoku indicator seems to also confirm the bullish trend, as the price is above the cloud, and the cloud looks quite thin and volatile, which may indicate an increase in volatility! ☁️🌈
What's next? 🤔
* If AUDT can confidently break and hold above the $0.61 - $0.62 zone, we may see further upward momentum! 🚀🌙
* In case of a rebound from this resistance, the price is likely to return to the lower boundary of the ascending channel for a retest. 🧐
We will closely monitor the developments! Which scenario do you consider more likely?
