⏰ Updated at 09:01 on 19/07/2025
Chart $LINK many notable points. After a spike up to 19.294, LINK has made a slight correction, currently fluctuating around 17.93. It seems to be stagnating, but deep down, there are still quite a few positive signals. Let's go through each frame one by one:
🕓 4-hour frame – Recovering after a correction, MA is providing good support
In the 4-hour frame, after reaching a peak of 19.294, LINK corrected down to near MA25 at 17.1 and is showing signs of bouncing back. The current price is approaching the MA7 area (18.15), indicating an effort to regain the upward trend.
MACD has just crossed up and the histogram is slightly positive, indicating that the downtrend has slowed down. RSI(6) is at 58 – not overbought yet, still room for the next upward move if the volume is strong enough.
=> Personally, I see the 4-hour chart forming a solid base around the MA25 – there is a high probability of a bounce back to test the 18.3 – 18.6 area if it holds above 17.7.
⏱️ 1-hour frame – Balancing out again, price is tightly accumulating after a sell-off
The 1-hour chart clearly shows that LINK had a strong sell-off from 19.294 down to 17.318 – then began to move sideways in accumulation. MA7 (17.77) is trying to cling to MA25, while MA99 is still quite far (16.88) → the medium-term trend is still upward.
MACD is still negative but shows signs of wanting to cross up, the histogram is narrowing. RSI(6) is at 52 – neutral zone, indicating that the market is balancing and waiting for new signals.
=> For me, the 1-hour frame is in a "resting phase." If it breaks through the light resistance at 18.0, it will activate short-term buying power again.
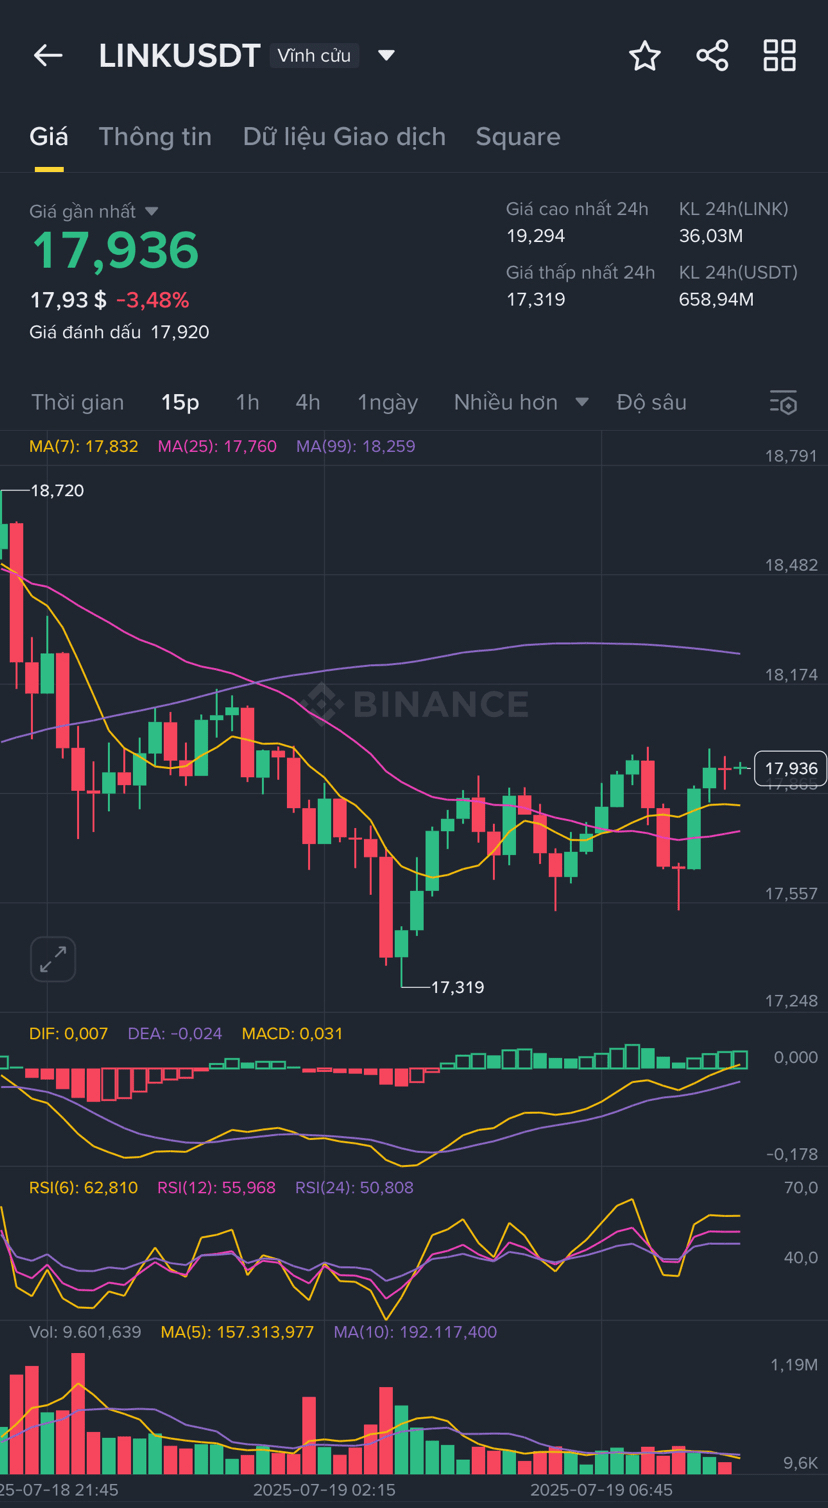
🕒 15-minute frame – Slightly increasing again, but confirmation is still needed
In the 15-minute frame, LINK just bounced back from the bottom of 17.319 and is approaching the 17.93 area. The price has now broken above MA7 and MA25 – both are gently sloping up, signaling recovery.
MACD is positive and expanding, RSI(6) is at 62.8 – still below the overbought threshold → short-term signal is positive.
=> I assess that the 15-minute chart is quite nice to watch for a break, especially when it is retesting the 18.0 area. If it breaks above this area with increased volume, it could pave the way back to 18.3 – 18.5.
📌 Summarizing my personal view:
LINK is experiencing a technical rebound after a strong correction. While the 4-hour frame is forming a solid base around MA25, the 1-hour and 15-minute frames are signaling accumulation and recovery. If it maintains the 17.7 – 17.8 area, there is a high chance it will test the 18.3 – 18.6 mark again.
However, if LINK does not break through the 18.0 area – it may need more time to accumulate and retest support.
🚀 The scenario I am monitoring:
🔸 Bull case: Holding at 17.7 – break 18.0 → heading towards 18.6 – 18.9
🔸 Bear case: If it does not break 18.0 – light correction to 17.3 – 17.4 and then reassess
👇 Anyone following LINK, do you have any additional insights? Let's discuss together!