Thinking back to when I first entered the trading market, I tried every possible way to find knowledge about this area online, hoping to learn everything as soon as possible so I could start practical trading and make money quickly.
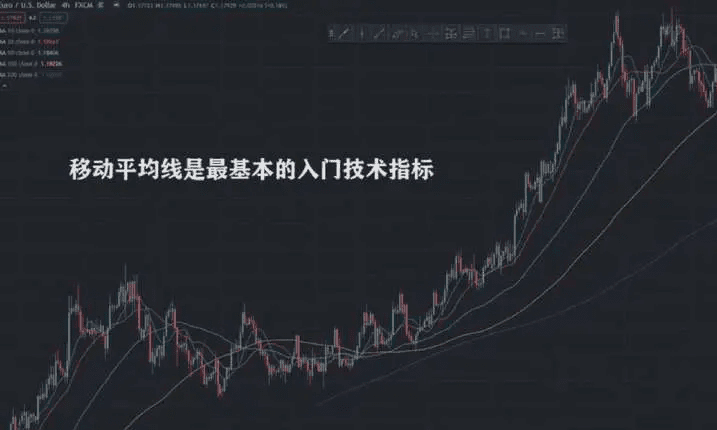
At this time, the moving average
Usually, these are the earliest technical indicators I learned, and most online teachings are about how to use two moving averages, one fast and one slow.
When the fast line crosses the slow line from below, you buy. When the fast line crosses the slow line from above, you sell.
The trading strategy of golden and death crosses is like a treasure for beginners because, compared to other more complex technical indicators, this matter is at least feasible for novices and can be monetized immediately. If you truly believe it and enter the market immediately, the results are predictable: you will definitely suffer significant losses, and then be mentally stressed every day, wondering why you lost money, blaming heaven, blaming earth, and blaming that moving averages are useless garbage.
The above is 100% my true experience, a mistake I made when I first started trading. I believe it is also the experience of many new beginners today. Today, I hope to share with you all the moving average techniques I have learned over the years, summarizing the mistakes I made and the insights I gained, so that you won’t repeat my mistakes. At the very least, your path will be much smoother than mine back then.
I summarized that most people have a misunderstanding of moving averages, which is too superficial. They simplify the matter too much, thinking that just seeing a golden cross means buy and a death cross means sell. In fact, what we really need to do is think about how to use moving averages to maximize your profits and improve your trading performance.
Today, I will discuss two main themes with everyone.
1: Is there a universal parameter setting for moving averages?
2: How to use moving averages to help us achieve a threefold return.
1. The Secret of Moving Averages
What is a moving average? Conceptually, it is easy to understand. As the name suggests, it is the average price over a certain period, presented in a line graph.
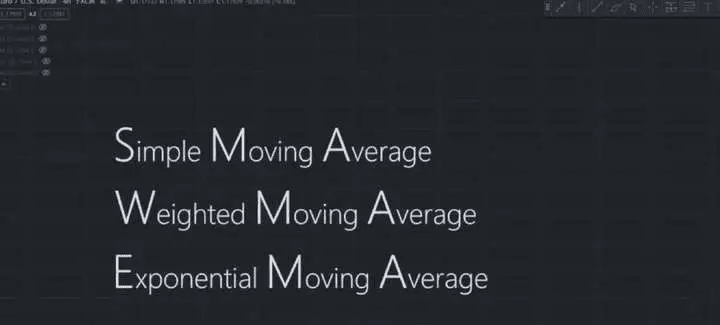
There are three common types of moving averages.
SMA (Simple Moving Average)
WMA (Weighted Moving Average)
EMA (Exponential Moving Average)
SMA is simply dividing all prices to get an average. It reacts slowly to recent prices and market trend changes. EMA and WMA are conceptually similar but have different algorithms.
They tend to give more weight, so the speed of response will be faster, and they will be more sensitive to recent large price changes.
1: Is there a universal parameter setting for moving averages?
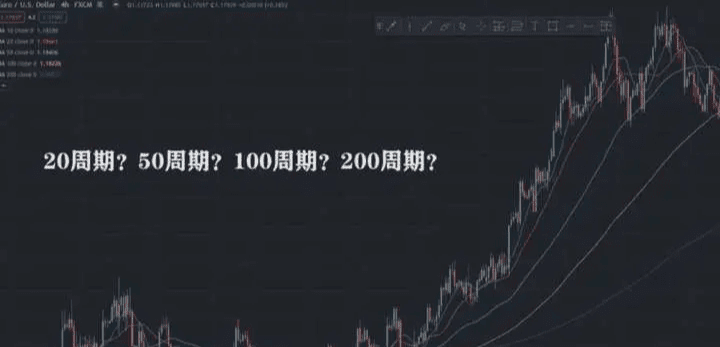
In fact, the most common question about moving averages is whether there is a universal parameter for moving averages and what the best parameter is: 20? 50? 100? Or 200?
This question is like when you go to a coffee shop and tell the staff: Please give me a cup of coffee! The staff asks you: Sir, what kind of coffee would you like? I say I don’t understand these, just give me the best coffee. Generally, at this point, if you encounter an impatient staff member, they will randomly give you a cup of cappuccino, you pay, and then leave.
It's like some online teaching tells you to use the 144 EMA and 68 EMA, and whenever the 68 crosses over the 144 EMA, you should buy or sell, which is completely confusing.
On the contrary, those responsible and patient staff will slowly guide you: Sir, would you like iced coffee or hot coffee? Do you want your coffee with milk or without? The foam on the Cappuccino is softer, while the Mochachinno has chocolate syrup and is a bit sweet. The Espresso is rich and leaves a sweet aftertaste. If you like black coffee, you will definitely be satisfied.
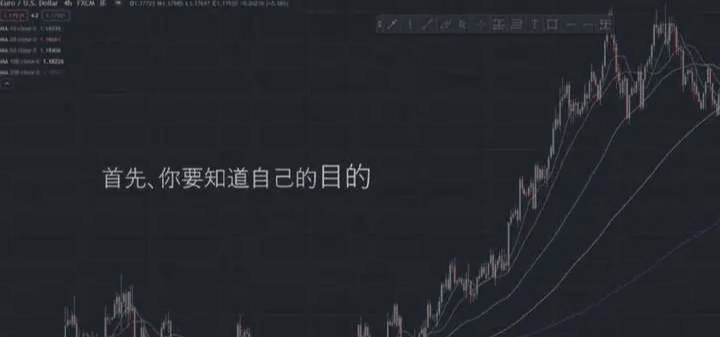
Similarly, as a responsible and patient trading coach, I would ask, what is your purpose in using moving averages?
Do you want an objective indicator to judge the long-term trend? Or do you want to strive for a better entry point? Or do you want to use moving averages to set a stop loss?
All of the above things can actually be achieved using moving averages.
But here's the point, I can responsibly tell everyone here
There is no best moving average parameter setting in this world.
Only the most suitable parameter setting!
However, this parameter should not be determined by you or me, or anyone. The market itself decides this. Depending on different market conditions, different trends, and strengths, the most suitable parameter settings will also vary.
We will judge based on two words: which period's moving average is most suitable for this market. These two words are - compliance.
Here, I use the three most common moving average periods of 20, 50, and 200 as examples. Let's look at how these three parameter settings are followed by the market.
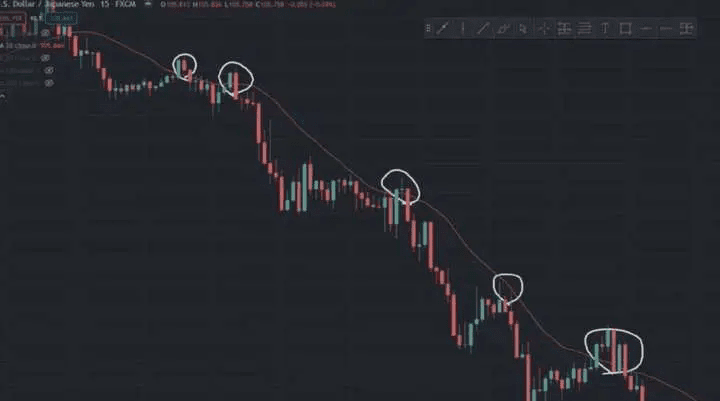
We see that in the above image, the current price is in a downtrend. We see that every time the price touches the 20 EMA, it seems to be under some invisible pressure to continue to fall, which tells us that the current market is following this 20-period EMA.
Now let's switch to compare the 50 and 200 period moving averages. Do you see the difference? They corroborate that the market is in a strong trend because the 20 period moving average is most suitable for a relatively fast trend with a smaller retracement.
The second example
I use the 50-period EMA and also see that the market is following the 50-period moving average. This situation represents that the market is in an upward trend.
If we look at the 20 and 200 EMA, we will find that the 20 EMA is not very suitable because it constantly intersperses between prices, while the 200 EMA is too far from the prices.
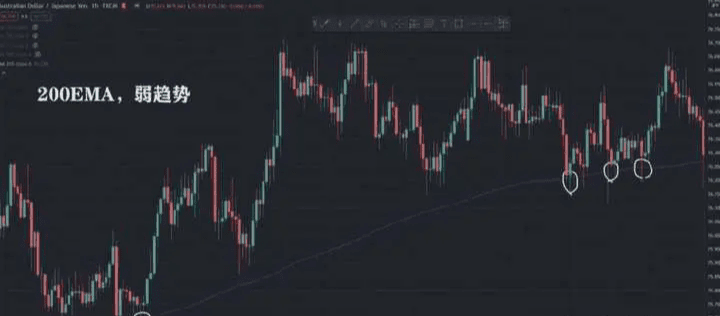
The last example, 200 EMA, is more suitable for a long-term and relatively weak trend. Although the intervals when the price touches are relatively far apart, from a broader perspective, the market is following this 200-period moving average.
Overall, it continues to move towards an upward trend.
We open the 20 and 50 EMA to take a look. It seems they are interspersing like fools in a relatively slow or visually indistinguishable trend. The 200 EMA is a good choice. I wonder if the above knowledge has inspired you.
2: How to use moving averages to help us achieve a threefold return.
Next, I will talk about the second question that more friends are concerned about, which is how we can use moving averages to improve our trading. Here, I will divide it into two parts.
First: Use moving averages as a filtering condition.
2: Use moving averages to find a better entry point and achieve a better risk-reward ratio.
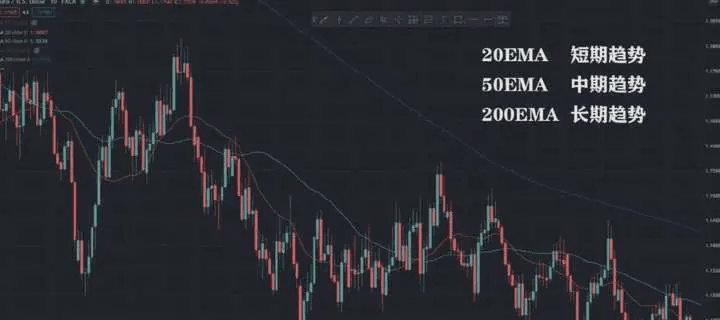
As we mentioned earlier, moving averages of different periods can reflect different strengths of trends. The 20, 50, and 200 EMA represent short-term, medium-term, and long-term market trends, respectively.
Here, I will take the long-term trend, which is the 200 EMA as an example. If the price stays above the 200 EMA, we can judge that the long-term trend is upward. If the price is below the 200 EMA, we can judge that the long-term trend is downward.
Of course, this is just a rough judgment method; ideally, you should use Price Action.
(Price Action trading method), but for beginners, Price Action is relatively complex, so I suggest that before learning Price Action, you can temporarily use a 200 EMA as a filtering function to filter out some trades that conflict with the market trend.
(Of course, later, I will update courses on Price Action, don't forget to follow up in time)
I don't mean to say that contrarian trading cannot be done. If done well, contrarian trading can also be very profitable, but trading against the trend has a low win rate, and the conditions required are relatively high. A deeper understanding of the market is necessary. For friends with less experience, I hope you first learn to trade with the trend, trying to follow the market's overall direction in each trade.
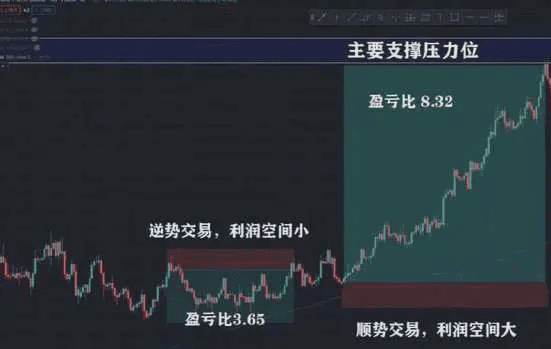
Let's look at this example where the price is above the 200 EMA. Assuming I see a sell signal and go short, logically, my take profit should be set at the 200 EMA.
On the contrary, if I make a trend-following trade and go long, my profit potential is much larger, and I can reach the next key market level (which is the main support and resistance level).
Generally speaking, doing trend-following trades is the best choice before the market reaches a pressure point, just like the current BTC trend, from $1800 to $20000, from $20000 to $30000, from $30000 to $40000.
......
No one knows where the top is, so let's not guess the top.
The second matter
How to use moving averages to find a better entry point and achieve a better risk-reward ratio.
How to ride a major trend. Here I will compare two trading methods using moving averages: the golden cross and death cross, and the interaction between price and moving averages. I personally believe that the more logical trading method is to look at the interaction between price and moving averages. On the same chart, two different trading methods, the same stop loss point, the same take profit point. Because of different entry timings, the outcomes will be two different things.
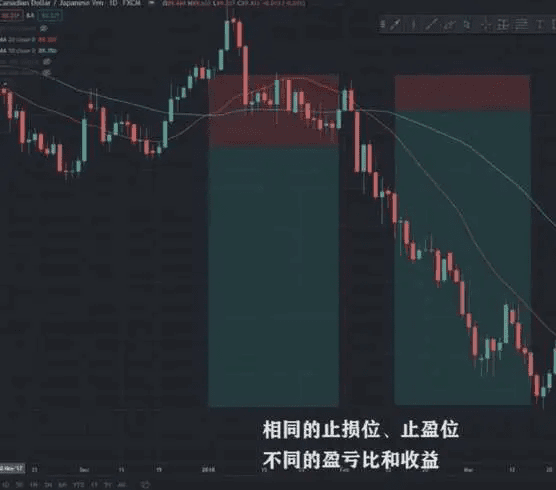
On the left is a signal where the 20 EMA crosses down through the 50 EMA, with a risk-reward ratio of 3.65. On the right is an entry based on the price interacting with the 20 EMA, with a risk-reward ratio of 8.32. Ah! Do you see?
Although this situation is an example I deliberately selected, similar situations will continue to appear in the market. We can see from the left-side death cross example where the 20 EMA crosses below the 50 EMA, using the previous high as a stop loss point. Assuming we are skilled enough to ride the entire trend, for every $1 risk we take, we get a return of $3.65.
Let's look at the example of price interacting with the EMA again, with all other conditions unchanged.
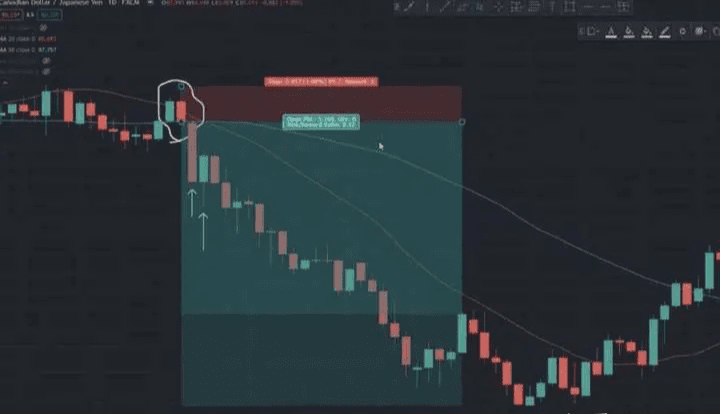
Because we see that the price made a false breakout at the 20 EMA, and when the next candlestick ended, a bearish engulfing pattern appeared. Compared to the death cross, we entered two candlesticks earlier, reacting a bit faster, so the returns we got were a bit higher.
Do you understand? With all conditions unchanged, as long as you have a better entry point, you will have a better risk-reward ratio. At critical moments, if you win once, it can offset several of your failed trades. Only in this way, over time, can you make money and make big money. Those who trade short-term rarely make money and are also very tired.
Therefore, for beginners, I sincerely advise you that there are hundreds of technical indicators on the market. You really don't need to learn them all. It’s better to choose one, dig deep into it, and master it. That will be enough for you.
I have seen too many experts who can achieve 100% profit just based on candlestick patterns, countless in number.
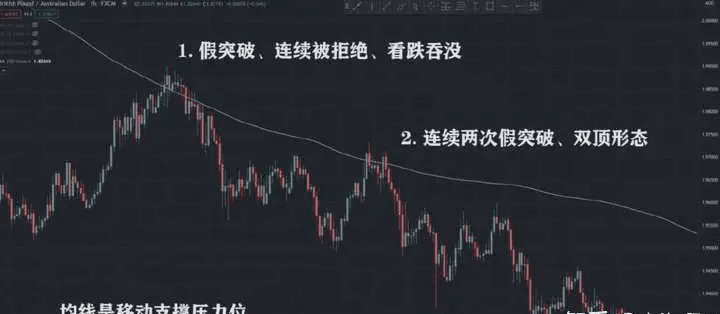
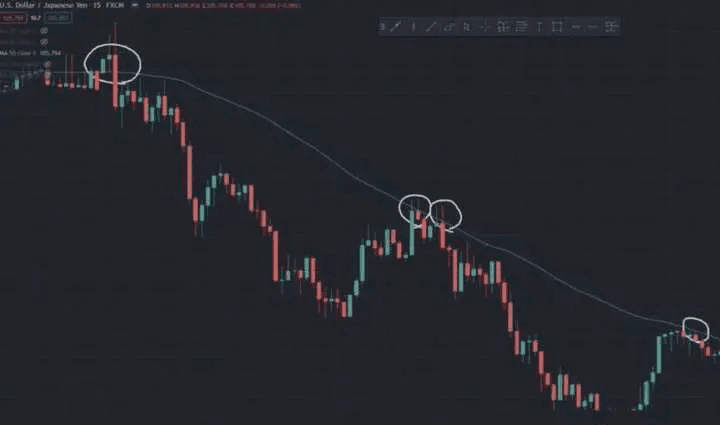
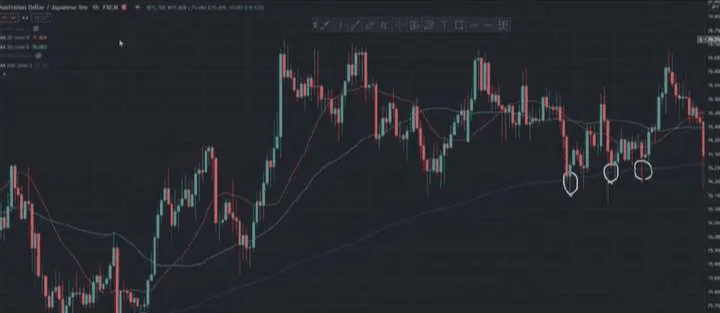
Next, let's look at an example of price interacting with the moving average. This is a 200 EMA. Within this roughly one-month period, we see that the price touched the moving average only twice, meaning we only had two trading opportunities.
The first time we see a false breakout at the 200 EMA, a bearish engulfing pattern, and we see that the shadow line tells us that the price attempted to go up but was rejected.
The second time we see that the price made two consecutive false breakouts near the EMA, plus a double top pattern, we again entered to short, and just like the first time, the result was good.
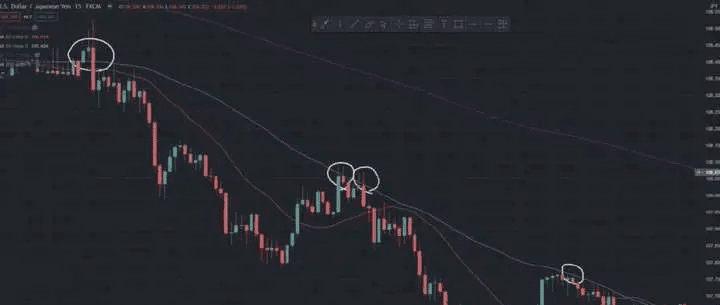
The first two examples were about getting a better risk-reward ratio through the interaction between price and moving averages. You should know that moving averages are essentially dynamic support and resistance levels. Whenever the price retraces to these key levels, we pay attention to see if there are opportunities to enter. Trades made at these positions usually have a good risk-reward ratio, which is a trading method I personally recommend using moving averages.
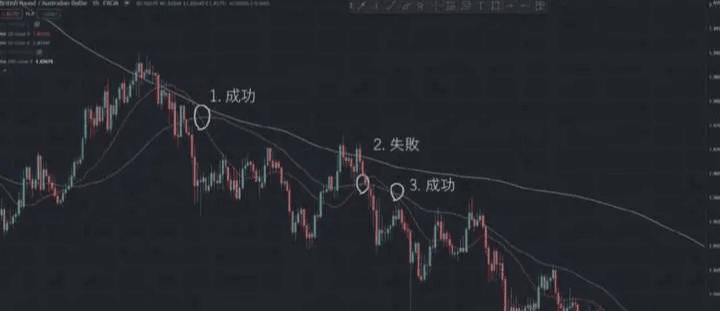
But when we compare the 20 EMA and 50 EMA, we see that there were three trading opportunities during this period. Roughly, there were two profitable trades and one loss, which sounds pretty good.
But if we look deeper, we will find that the profit and loss ratios of the two trading methods cannot be compared. The final profit difference exceeds one time. Do you understand?
Strong recovery, doubling assets! Stay close to the rainy day, layout in advance, and easily reap huge returns.
Continue to follow: CROSS AVAAI