A brief and accurate analysis of XRP/USDT based on the three images:
---
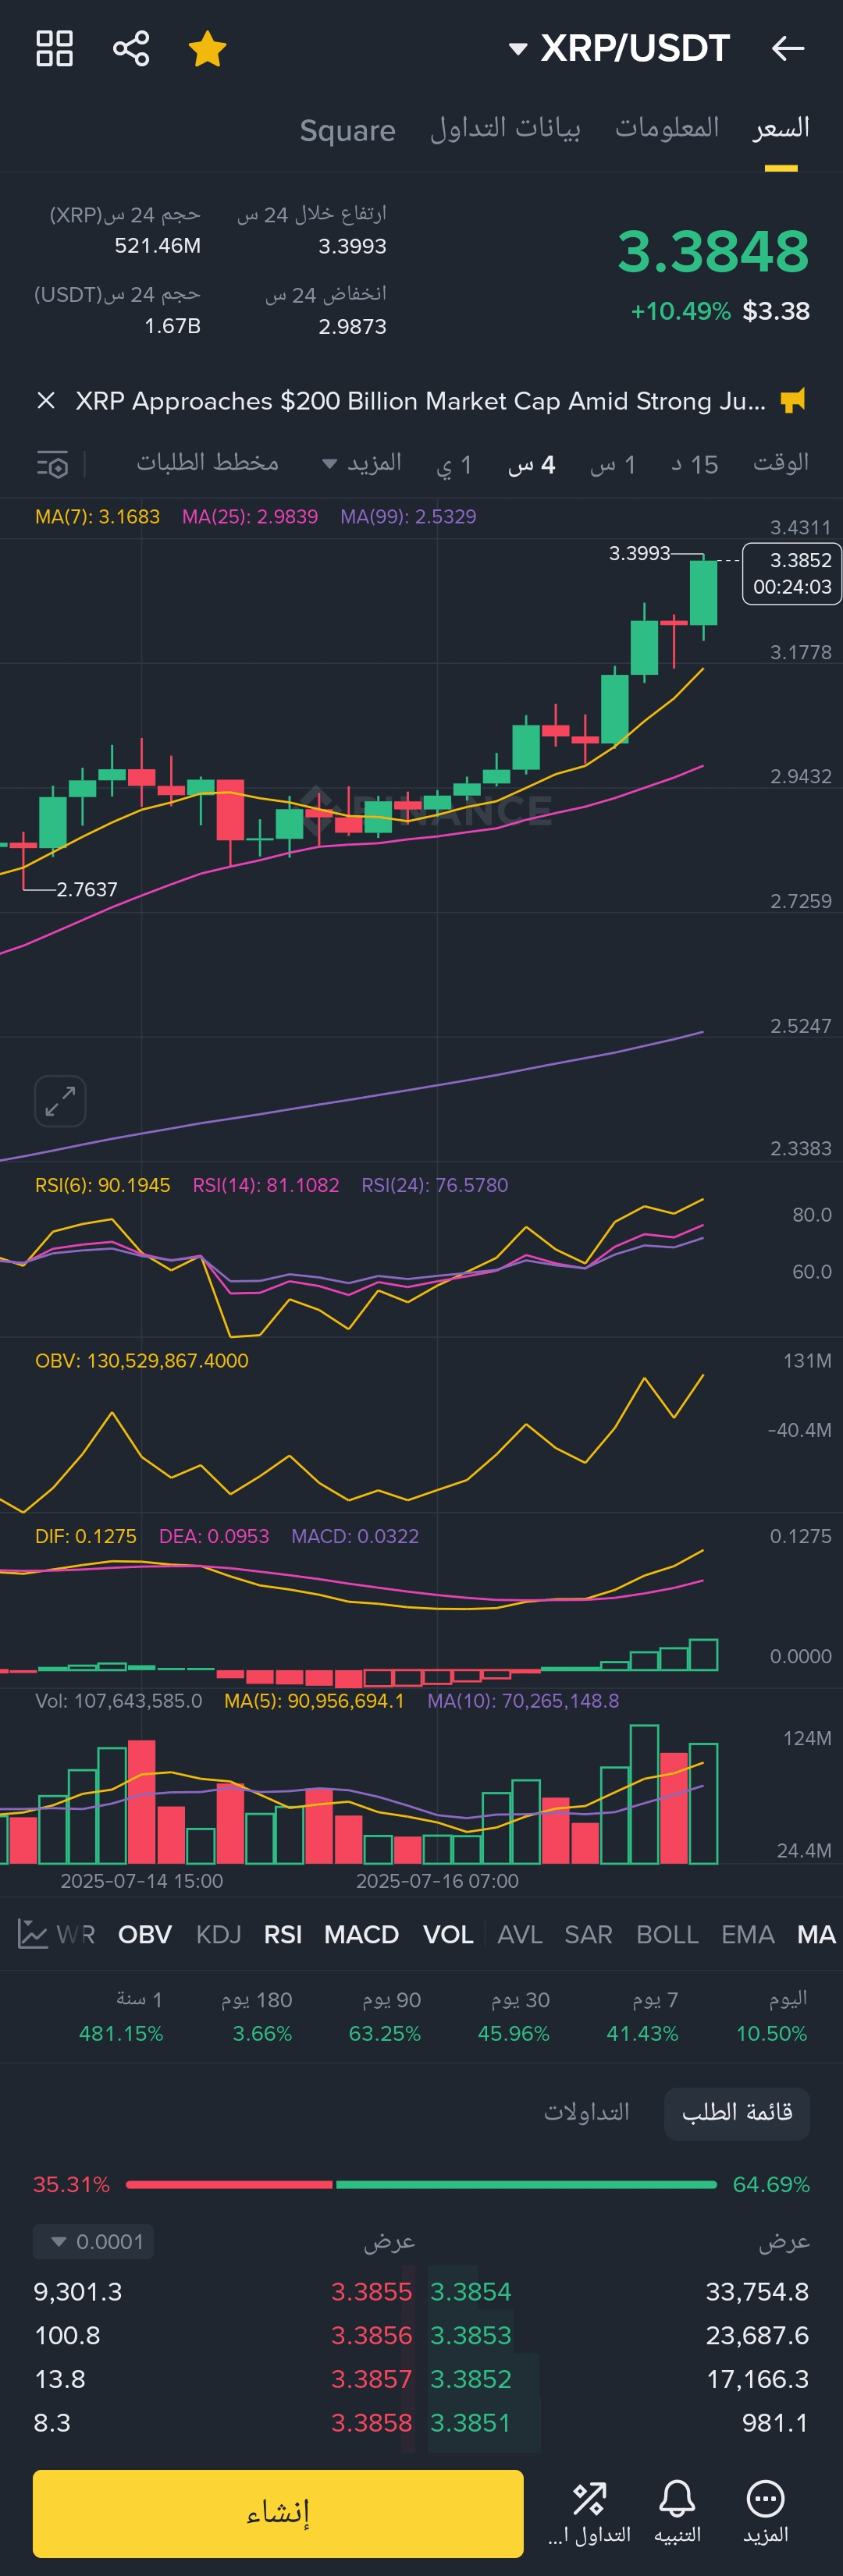
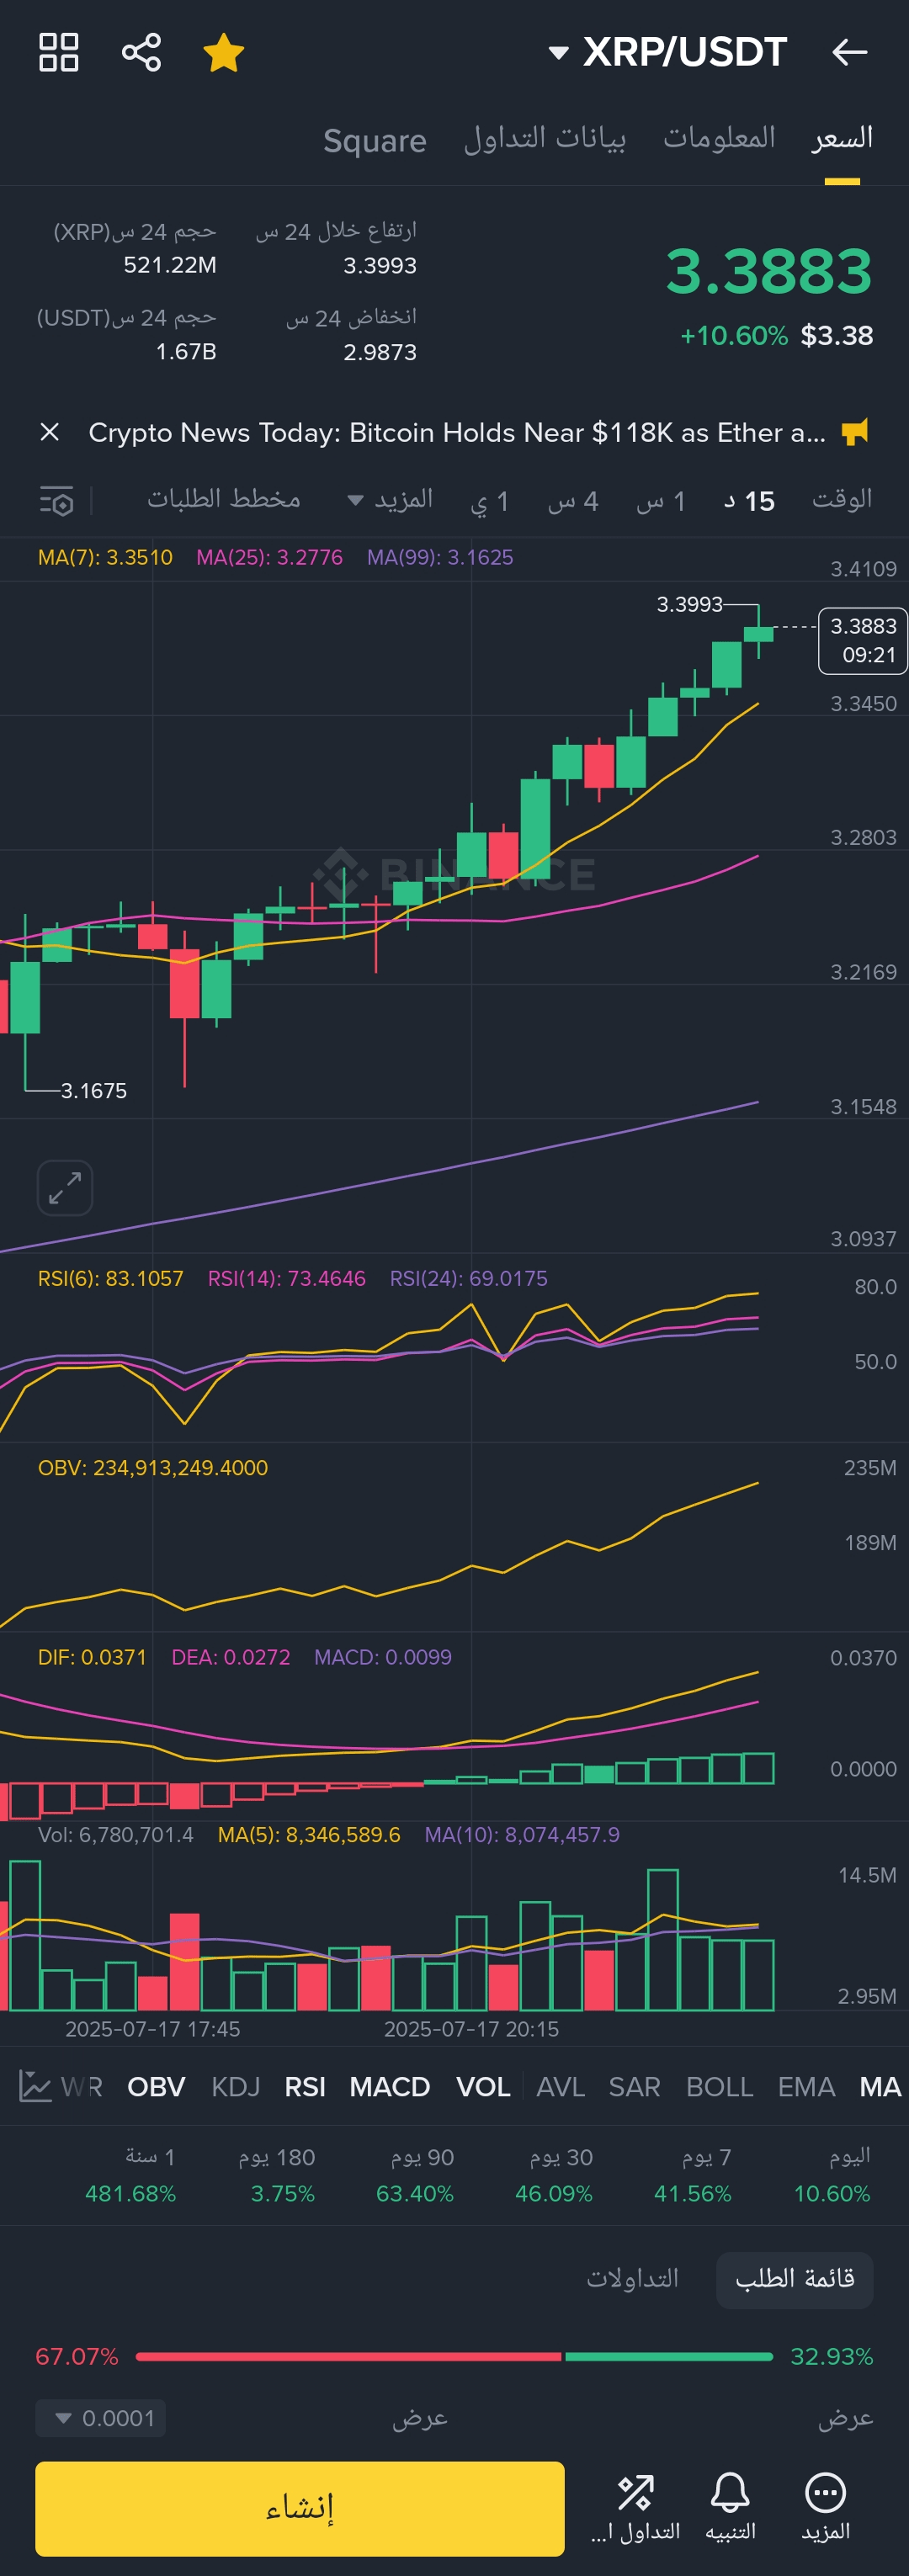
📈 General trend: strong and clear rise
All time frames (1 day, 4 hours, 15 minutes) show green bullish candles.
The highs and lows are gradually rising, confirming the uptrend.
---
🔥 Momentum:
RSI indicator:
RSI(6) = 94.95 / 90.19 / 83.10 → Very overbought.
RSI(14) and RSI(24) are all above 70 → very high momentum.
MACD indicator:
Clear positive crossover in all frames.
The difference between the MACD and Signal lines is widening → accelerating bullish momentum.
---
💰 Liquidity (Volume & OBV):
Trading volumes are very high on all frames.
OBV is strongly bullish → confirmation of a large buying liquidity entry.
---
💹 Buying and selling areas:
Current buy ratio (last image): 32.93% only → Lots of sell orders now.
This indicates a possible correction soon despite the overall upward trend.
---
📍Entrance fee:
Current price: around 3.38 - 3.39 USDT.
Entering now is risky because:
RSI is in saturation.
The price is close to a local resistance at 3.3993.
✅ Better entry price in case of correction:
3.15 – 3.25 USDT (strong support area according to MA and previous lows).
Or partial entry now and buy the rest of the quantity at any correction.
---
🔮 Future prediction:
XRP ETF announcement (as in the title) may be the reason for the rally.
If the price stabilizes above 3.40, we may see a new upward wave towards:
3.70 – 4.00 USDT as short to medium term targets.
⚠️ Warning:
Due to the rapid rise and excessive momentum, a correction is very likely in the coming hours.
📌 Recommendation:
Status Suggested Action
Quick scalper take partial profit or monitor RSI for correction
Average investor waits for correction and enters between 3.15 - 3.25
Long-term investor can hold part of the amount and gradually buy
Buy now and do not hesitate, the adventure is half the profit