Key Terms & Their Meanings
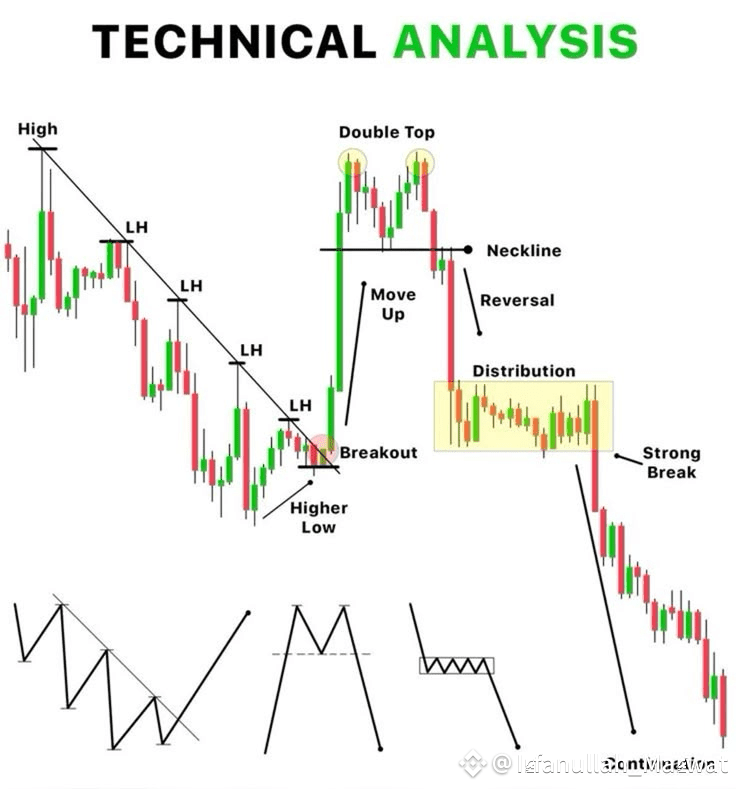
1. "High"
A peak in price where resistance is encountered — sellers tend to step in.
2. "Double Top"
A bearish reversal pattern:
Price reaches a high (first top), pulls back.Rallies again to a similar high (second top). Fails to break higher and drops. Confirmed when the price breaks below the neckline (the support between the two tops). Indicates potential shift from uptrend to downtrend.
3. ""LH" – Lower High
Each subsequent peak is lower than the previous one. Signals weakening bullish strength and rising bearish control.
4. "Move"
Refers to the downward price movement after the pattern confirmation.
5. "Breakout"
Usually refers to a bearish breakout below the neckline, confirming the double top.
Could also refer to an upward breakout if price later reverses direction.
6. "Strong Continuation"
Implies the trend will likely continue in the direction of the breakout. In this case: a strong bearish continuation.
👉 How the Pattern Works in Trading
1. Pattern Formation
Identify two clear peaks (tops) with a trough in between. Draw a neckline across the low between the tops.
2. Confirmation
Pattern is confirmed once the neckline is broken (usually with strong volume).
3. Target Calculation
Measure the height from top to neckline. Project the same distance downward from the breakout for the price target.
4. Watch for False Breakouts
Be cautious of "fake outs" (e.g., price briefly dips below neckline then reverses). Wait for a candle close below the neckline or use volume as confirmation.
👉Trading Strategy Example
Short Entry: After price closes below the neckline. Stop-Loss: Just above the most recent lower high.
Take-Profit: Equal to the height of the double top projected downward.
👉 Important Notes
No pattern is 100% accurate — always use risk management. Strengthen confirmation using indicators like RSI, MACD, or Volume.
$SOL $XRP $NEWT #BinanceHODLerERA #USCryptoWeek #ETHBreaks3k #TradingStrategyMistakes


