$PEPE price sits above all key moving averages, including the 50-day Exponential Moving Average (EMA) at $0.00001112, the 200-day EMA at $0.00001101 and the 100-day EMA at $0.00001089.
Two Golden Cross patterns further reinforce the bullish outlook, starting with the 50-day EMA cross above the 100-day EMA on Sunday and the same 50-day EMA flip above the 200-day EMA on Wednesday.
PEPE/USDT daily chart
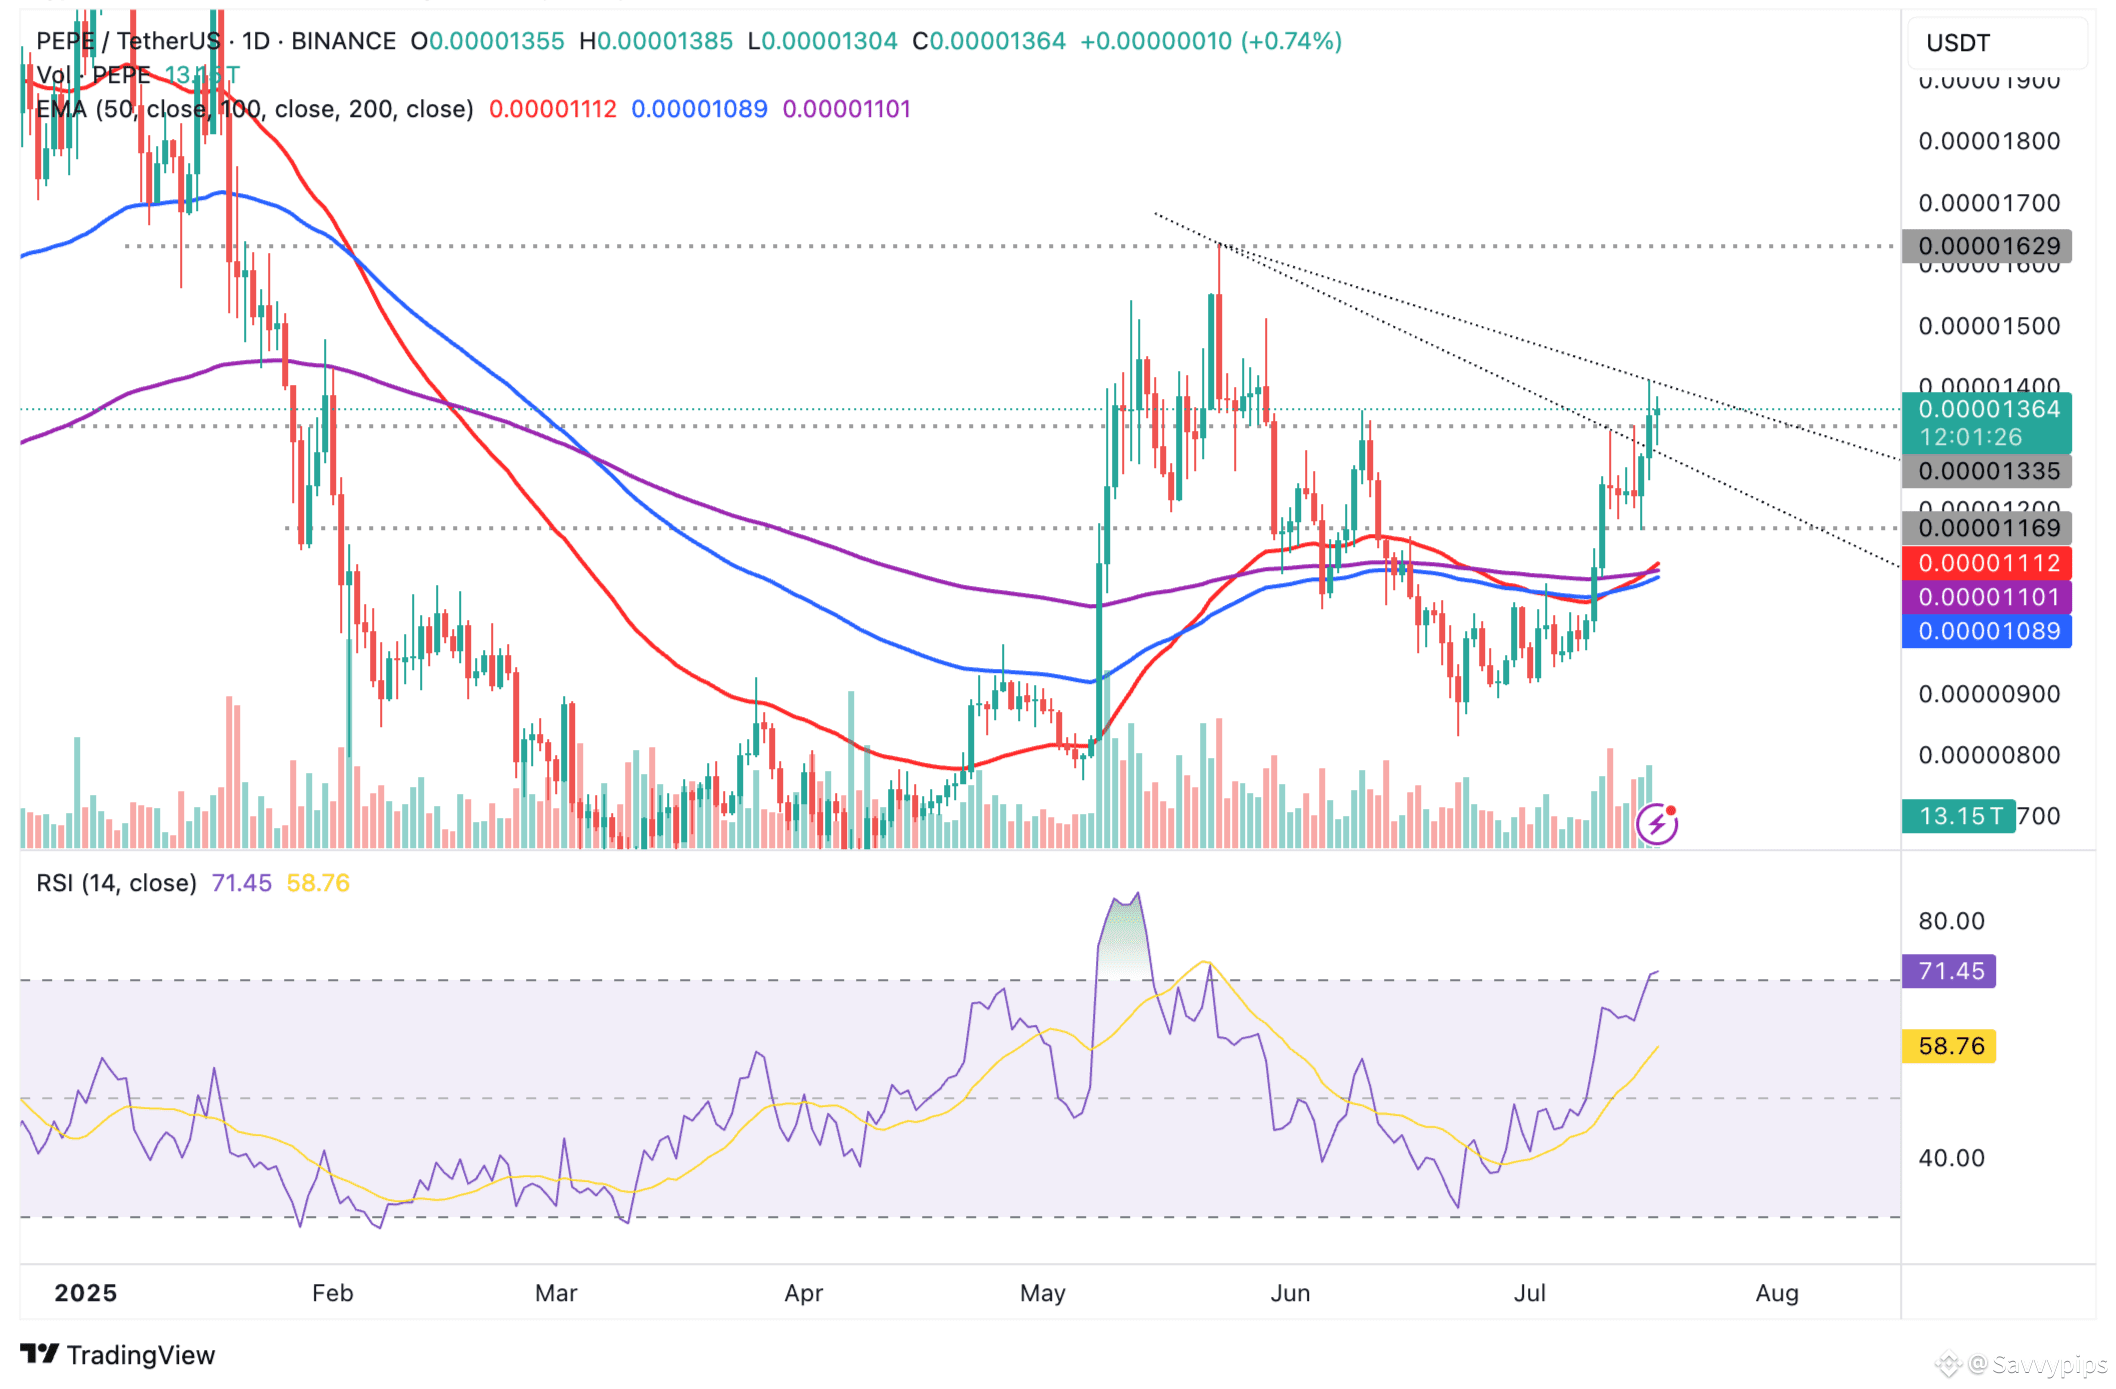
Traders will consider increasing exposure due to the Golden Cross patterns, as well as the upward-looking Relative Strength Index (RSI) at 71. If the RSI holds steady, it will $PEPE signal bullish momentum.
Still, traders should temper their bullish expectations if the RSI retreats into neutral territory, suggesting a decline in demand for the token. Profit-taking and changing market dynamics, driven by macroeconomic risks surrounding the implementation of higher tariffs in the United States (US), could contribute to sell-side pressure.
#PEPE #MemecoinSentiment #PowellVsTrump #BinanceHODLerERA #TradingStrategyMistakes