#XRPAnalysis $XRP ( Trade On your Risk)
📊 Technical Overview & Chart Patterns
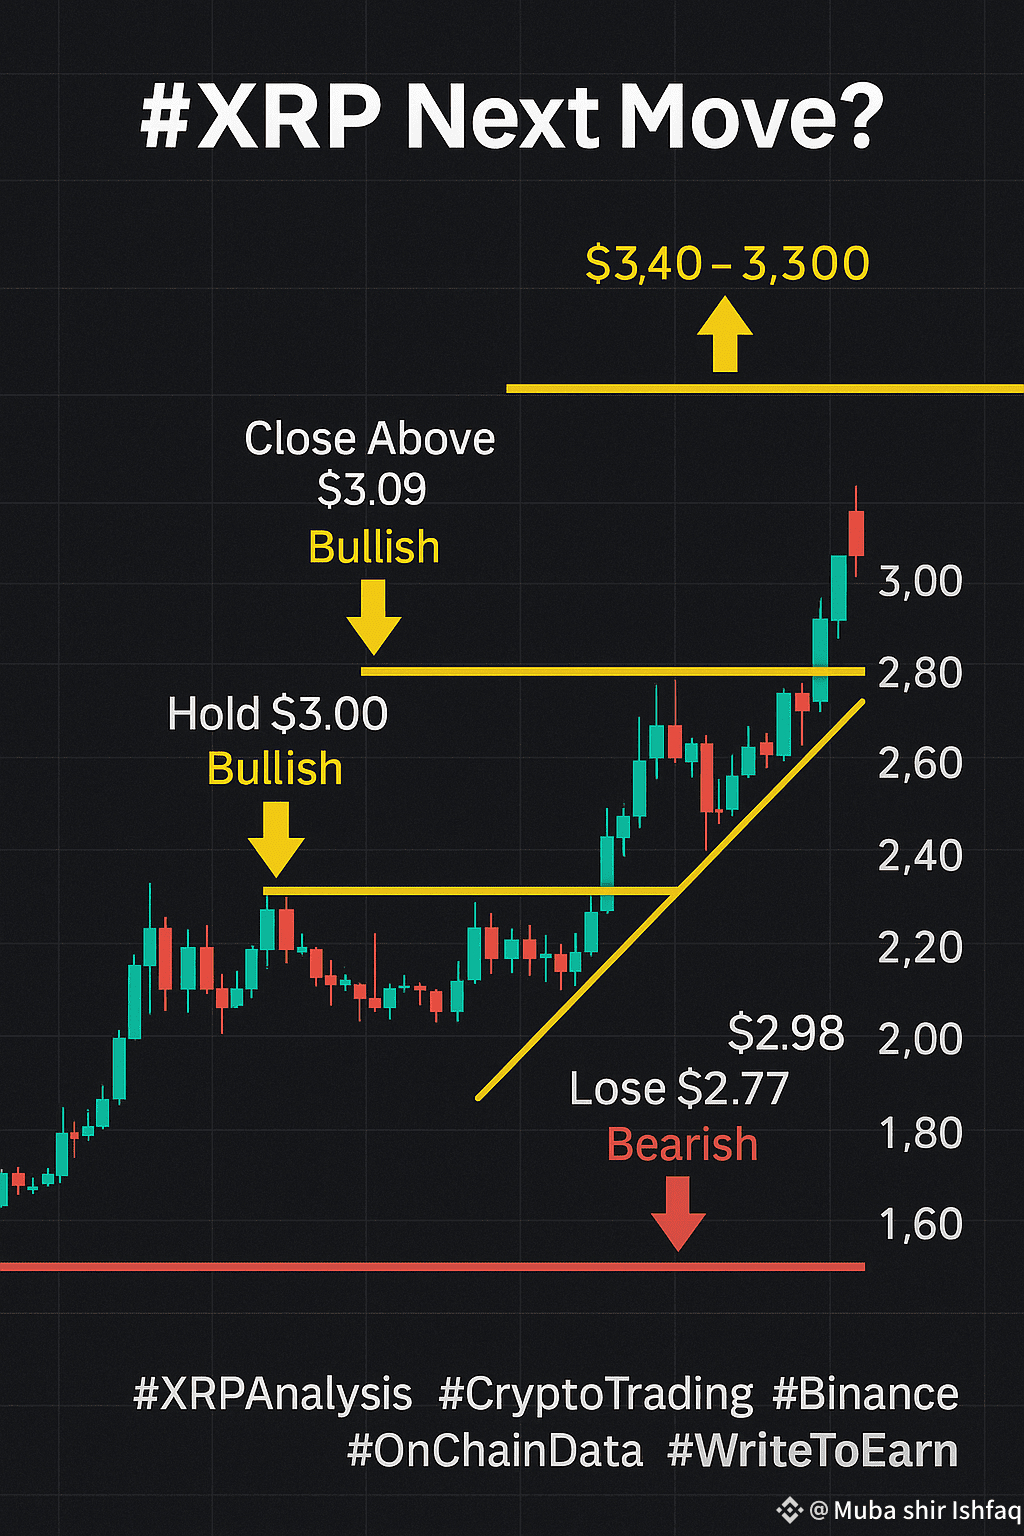
**$3.00 Breakout Confirmed**: $XRP surged above the $3.00 mark with heavy trading volume (~170M), signaling strong institutional momentum, particularly ahead of the XRP futures ETF launch.
Triangle Breakout:
Historic symmetrical triangle with converging support/resistance. A breakout above ~$0.66 (or scaled equivalent in current price) earlier pointed to potential bullish expansions.
Technical Indicators:
Daily and weekly moving averages (50‑, 200‑day) are trending upward. Most platforms label XRP a “Strong Buy”.
Oscillator Flags: RSI is overbought in higher timeframes, which may lead to short-term consolidation.
🌐 On‑Chain & Institutional Signals
High Exchange Reserves & Whale Moves: Significant inflows to exchanges and whale transactions suggest a short-term correction could be near (~20%) toward ~$2.34–2.77 region.
ETF Backing & Institutional Flow: Futures ETF anticipation, plus supportive macro-regulatory developments, back up the bullish narrative.
🧭 Decision Matrix: Bullish, Bearish, or Neutral?
Indicator Bullish Signal Bearish Signal
Price Action Sustained close above $3.05–3.09 ➝ rally to $3.40–$3.60+ Fails to hold $2.98 → dip toward $2.77 / $2.34
Volume/Flows Institutional inflows, low reserves ➝ sustained momentum Exchange accumulation / whale selling pressure
Tech Indicators Moving averages up, “Strong Buy” consensus Overbought RSI could trigger a minor cooldown
🔍 What to Watch Now
1. Hold Above $3.00 with strong volume — bullish case remains intact.
2. Close Above $3.09 → high probability of $3.40–$3.60 move, possibly toward $4–$5.
3. Watch Exchange Reserves & Whale Moves — elevated levels could prelude a pullback.
4. Set Smart Stops — key zones: $2.98, $2.77, and deep support at $2.34.
📌 Summary – Bullish, but Caution Needed
Sentiment: Fairly bullish — price action and volume support continuation.
Risks: Overbought RSI and on‑chain indicators point to a possible 10–20% pullback.
Tactical Moves: Use $2.98–3.00 as a pivot. Plan entries on dips and scale out above $3.40.
Bull Trigger: Break and hold above $3.09 with volume = confidence for next rally phase.
Bear Trigger: Drop below $2.77 on rising exchange flows = expect a short-term correction.
✅ Trading Edge
For Bullish Traders: Buy dips above $2.98, target $3.40–3.60, trail stop-loss near $2.90–2.95.
For Conservative Traders: Wait for breakout past $3.09 then enter — mitigates risk of false move.
For Bears: If $2.77 breaks on high exchange inflow, prepare for a retrace to ~$2.34.
#cryptotrading #Binance #OnChainDataInsights #Write2Earn

