🔹 Neutral Candlestick Patterns – Signs of Indecision or Strength
These candles don't clearly point to either direction but offer valuable clues depending on context.
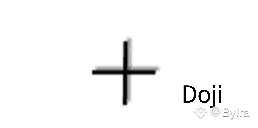
1. Doji:
Open ≈ Close price, looks like a cross.
🧭 Why it forms: Balance between buyers and sellers.
📉📈 Effect:
After an uptrend → possible reversal
After a downtrend → possible reversal
In a range → market indecision
💡 Always wait for the next candle to confirm the direction!
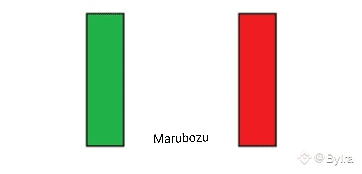
2. Marubozu:
Long candle body with no (or very small) wicks.
Bullish Marubozu (green):
🧭 Buyers dominated start to finish
📈 Effect: Continuation of uptrend
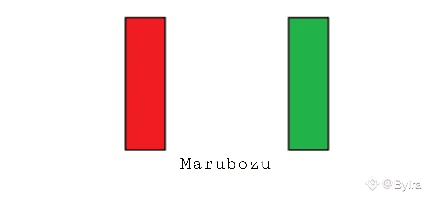
Bearish Marubozu (red):
🧭 Sellers were fully in control
📉 Effect: Continuation of downtrend
🧠 Pro Tips: Read Candlesticks Like a Pro
✅ 1. Context Matters More Than Shape
A hammer near strong support = bullish
Same hammer in the middle of nowhere = noise
A doji near resistance = stronger signal than in a sideways market
📌 Always consider support/resistance and trendlines
✅ 2. Timeframe Matters
Candlestick patterns on 1D or 4H = more reliable
On 1-min or 5-min = often noise
📌 Rule: Don’t trade major signals on small timeframes
✅ 3. Combine Candles with Other Tools
Use with RSI, MACD, trendlines, volume
📈 Example: Bullish engulfing + oversold RSI + support = strong setup
📉 Same pattern without context = risky trade
📚 End of Lesson 3:
This lesson offered a complete and in-depth breakdown of candlestick psychology and structure — bullish, bearish, and neutral patterns — with reasoning and real impact.
📆 See you Tomorrow at 11 PM GMT
#Lesson3 #CandlestickMastery #CryptoEducation💡🚀 #BinanceSquare #ChartPatterns


