🔹 Bearish Candlestick Patterns – Signals of Trend Reversal
These patterns often appear after a rally and indicate growing seller pressure. Recognizing them helps protect profits or plan short entries.
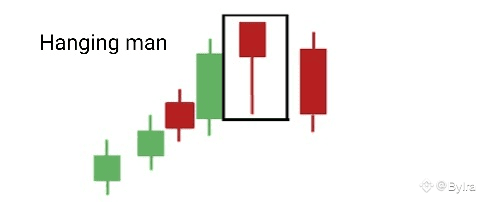
1. Hanging Man:
Small body at top, long lower wick.
🧭 Why it forms: Strong intraday selling rejected by buyers.
📉 Effect: Warning of weakening uptrend – needs confirmation.
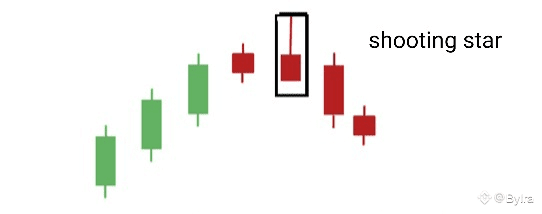
2. Shooting Star:
Small body at bottom, long upper wick.
🧭 Why it forms: Buyers failed to hold higher prices.
📉 Effect: Bearish reversal signal after a strong uptrend.
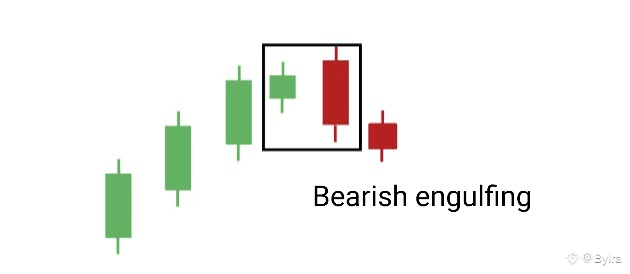
3. Bearish Engulfing:
Large red candle fully engulfs smaller green one.
🧭 Why it forms: Sellers regain control.
📉 Effect: Strong bearish reversal.
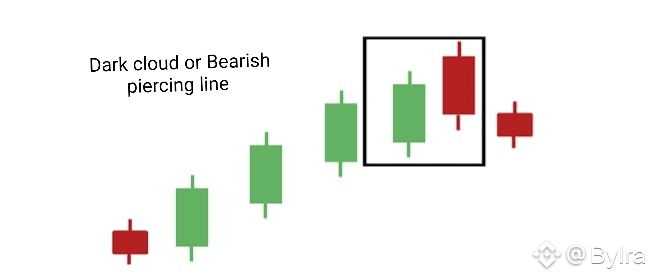
4. Dark Cloud Cover (Bearish Piercing Line):
Red candle opens above green one, then closes inside it.
🧭 Why it forms: Buyers lose momentum.
📉 Effect: Possible trend reversal downward.
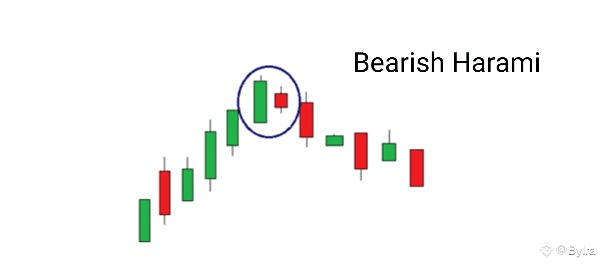
5. Bearish Harami:
Small red candle inside previous green one.
🧭 Why it forms: Buying weakens, market hesitates.
📉 Effect: Bearish signal – wait for confirmation.
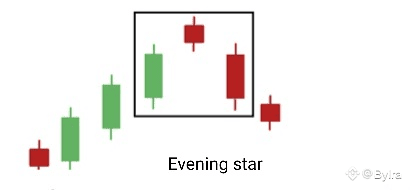
6. Evening Star:
Three candles: green → small candle → large red.
🧭 Why it forms: Buyers slow down, sellers take over.
📉 Effect: Strong bearish reversal.
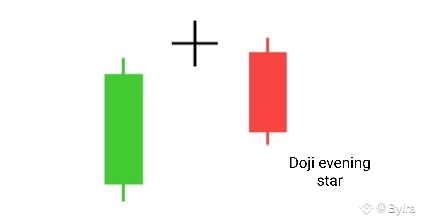
7. Evening Doji Star:
Like Evening Star but with a doji in the middle.
🧭 Why it forms: Indecision followed by selling pressure.
📉 Effect: Stronger reversal than standard Evening Star.
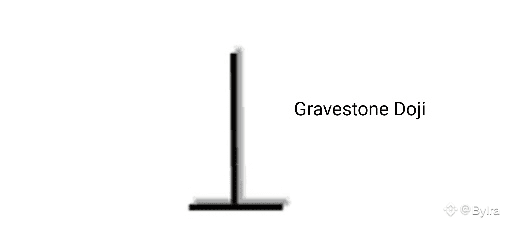
8. Gravestone Doji:
No lower wick, long upper wick.
🧭 Why it forms: Buyers pushed price up, but failed.
📉 Effect: Bearish, especially after an uptrend.
📌 In Part 3, we’ll cover neutral candlestick patterns and when to interpret them as potential turning points.
#Lesson3 #Part2 #BearishCandlesticks #CryptoCharts #BinanceSquare


